


C U E M I X F X
59
In
Min/Max
mode,
Min
and
Max
set the lowest and
highest displayed frequencies (in Hertz).
Vertical controls (amplitude axis)
The
Vertical
controls (Figure 9-7) operate similarly
to the Horizontal controls, except that they
configure the y-axis (amplitude).
In
Zoom/Offset
mode,
Zoom
sets the display zoom
from 1x to 100x, and
Pos
sets the center amplitude
of the graph.
In
Min/Max
mode,
Min
and
Max
set the smallest
and largest displayed amplitude.
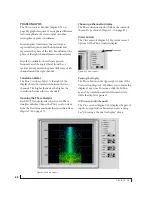
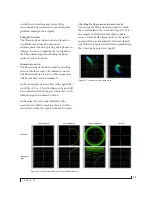
Spectrogram controls
The
Floor
control (Figure 9-5) sets the amplitude
threshold for the spectrogram display, from -144
dB up to 1 dB.
The
Alpha
control (Figure 9-5) sets the opacity of
the spectrogram information displayed in the
graph, from 100% (fully visible) down to 0% (fully
hidden).
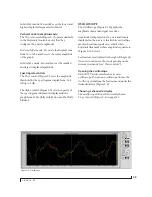
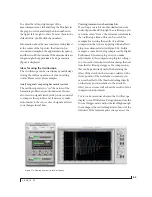
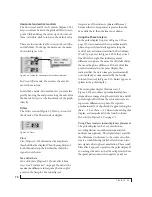
OSCILLOSCOPE
The Oscilloscope (Figure 9-10) graphs the
amplitude of an audio signal over time.
Amplitude is displayed on the y-axis and time is
displayed on the x-axis. A thick white vertical line
marks where time equals zero; a thick white
horizontal line marks where amplitude equals zero
(Figure 9-10, below).
Level meters are displayed to the right of the graph.
One or two meters are shown, depending on the
current view mode (see “View controls”).
Opening the oscilloscope
Each MOTU audio interface has its own
oscilloscope. To open an oscilloscope, choose the
Oscilloscope
item from the Devices menu under the
desired interface (Figure 9-6).
Choosing a channel to display
The oscilloscope follows the currently chosen
Scope channels
(Figure 9-1 on page 52).
Figure 9-10: Oscilloscope
Summary of Contents for 4pre
Page 4: ...4 ...
Page 5: ...Part1 GettingStarted ...
Page 6: ......
Page 10: ...10 ...
Page 16: ...P A C K I N G L I S T A N D S Y S T E M R E Q U I R E M E N T S 16 ...
Page 28: ...I N S T A L L I N G T H E 4 P R E H A R D W A R E 28 ...
Page 29: ...Part2 Usingthe4pre ...
Page 30: ......
Page 50: ...R E D U C I N G M O N I T O R I N G L A T E N C Y 50 ...


