


PAGE 8
VI. SENSOR OVERVIEW
Select
Sensors
from the main navigation menu to access the sensor overview page and
begin making adjustments to your Open/Closed Sensors.
MENU SYSTEM
Details -
Displays a graph of recent sensor data.
History -
List of all past heartbeats and readings.
Events -
List of all events attached to this sensor.
Settings -
Editable levels for your sensor.
Directly under the tab bar is an overview of your sensor. This allows you to see the signal
strength and the battery level of the selected sensor.
•
indicates the sensor is checking in and within user defined safe parameters.
•
indicates the sensor has met or exceeded a user defined threshold or triggered event.
•
indicates that no sensor readings are being recorded, rendering the sensor inactive.
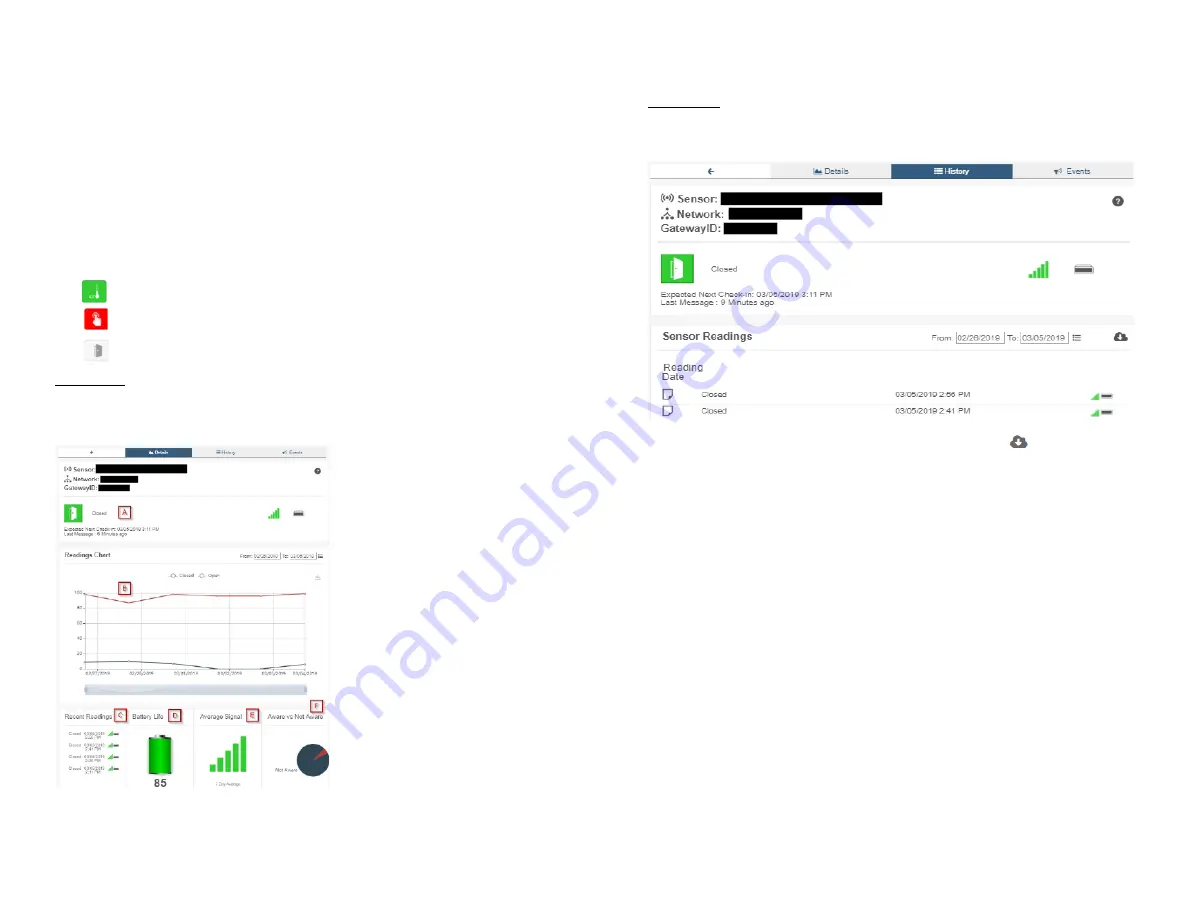
Details View
The Details View will be the first page you see upon selecting which sensor you would like
to modify.
A.
The sensor overview section
will be above every page. This will
consistently display the present
reading, signal strength, battery level,
and status.
B.
This graph charts how the sensor
fluctuates throughout a set date
range. To change the date range
displayed in the graph, navigate up to
the top of the Readings Chart section
on the right-hand corner to change
the from and/or to date.
C.
The Recent Readings section
below the chart shows your most
recent data received by the sensor.
D.
Battery Life displays the current
battery percentage remaining.
E.
The Average Signal shows the
most common signal strength of your
sensor. Low signal strength could be
a sign the placement of your sensor
should be adjusted.
F.
The pie chart in the Aware or Not Aware Section displays the percentage of aware states
your sensor has entered since activation.
History View
Selecting the “History” tab within the tab bar allows you to view the sensor’s data history as
time stamped data.
• On the far right of the sensor history data is a cloud icon.
Selecting this
icon will export an excel file for your sensor into your download folder.
Note:
Make sure you have the date range for the data you need input in the “From” and “To” text boxes. This will be
the most recent week by default. Only the first 2,500 entries in the selected date range will be exported.
The data file will have the following fields:
MessageID:
Unique identifier of the message in our database.
SensorID:
If multiple sensors are exported you can distinguish which reading was from
which using this number even if the names for some reason are the same.
Sensor Name:
The name you have given the sensor.
Date:
The date the message was transmitted from the sensor.
Value:
Data presented with transformations applied but without additional labels.
Formatted Value:
Data transformed and presented as it is shown in the monitoring portal.
Battery:
Estimated life remaining of the battery.
Raw Data:
Raw data as it is stored from the sensor.
Sensor State:
Binary field represented as an integer containing information about the state
or the sensor when the message was transmitted. (See “Sensor State Explained” below).
Gateway ID:
The Identifier of the gateway that relayed the data from the sensor.
Alert Sent:
Boolean indicating if this reading triggered a notification to be sent from the
system.
Signal Strength:
Strength of communication signal between the sensor and the gateway,
shown as percentage value.
PAGE 9


