


The left end of the frequency axis always represents 0 Hz. However, the 0 Hz line
and for velocity also the next line are not displayed to suppress DC and low noise
errors.
The line above the diagram shows magnitude and frequency of the main spectral
line.
To measure the spectral lines the cursor can be moved along using the ◄► keys.
The red pointer below the diagram marks the cursor position. The currently mea-
sured spectral line is highlighted red. The frequency and amplitude are also dis -
played below the diagram.
The amplitudes can be scaled using the Auto-range function. In the case of variable
signals this can cause an instable spectrum. If so, select between auto-ranging
(“Ampl. auto”) and fixed amplitude scaling (“Ampl. fixed”) by pressing OK repeat-
edly. In the case of fixed amplitudes, the scaling type most recently selected is re-
tained.
You can save the spectrum by pressing the ▼ key.
Press F3 to exit the spectral view.
6.9.2. FFT Memory
To view stored FFTs in the instrument open the main menu, select “Meas. data
memory” and “View FFT data memory”. The FFT data can be viewed in order of the
VMID serial number or the date it was saved. Select your preferred sorting option
and press OK to confirm. After a short waiting time the first FFT record will be dis-
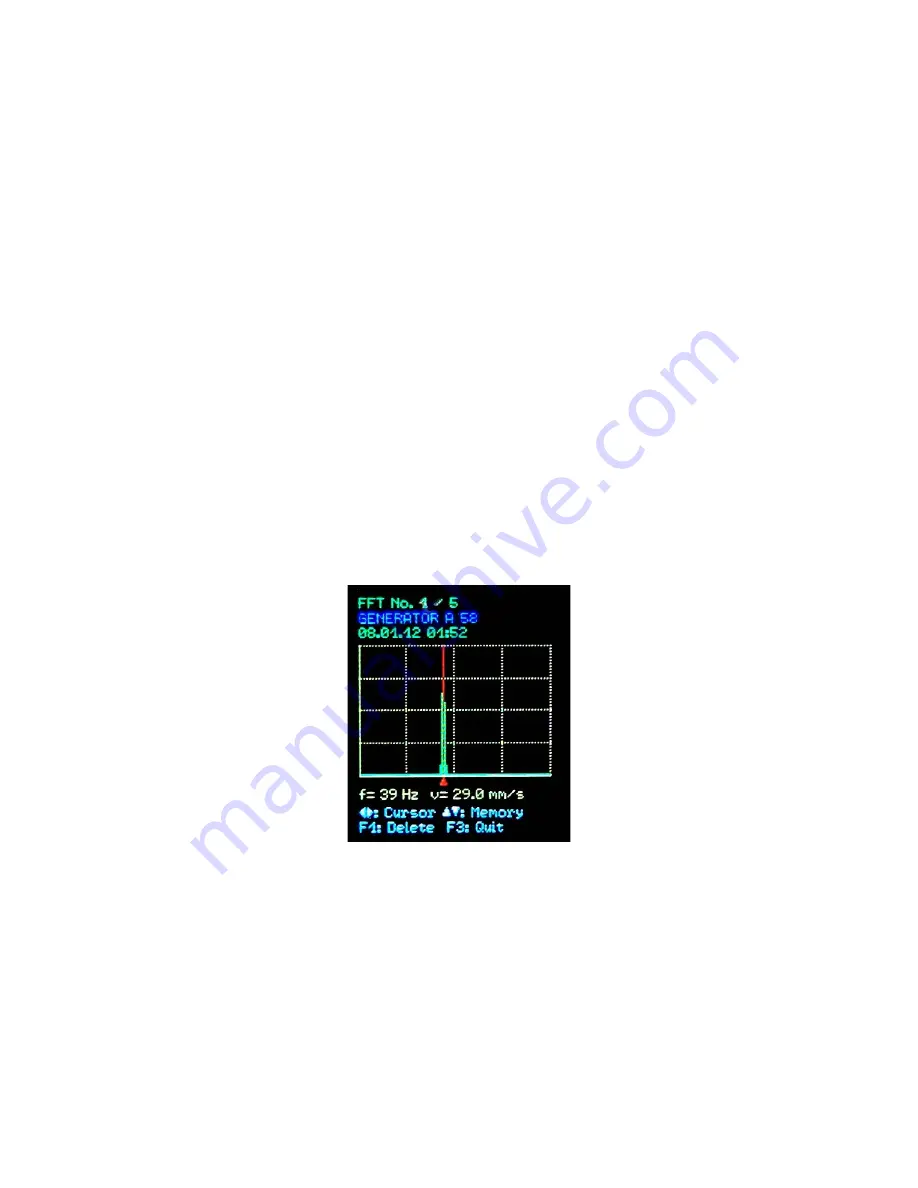
played (Figure 33).
Use the keys ▼▲ to load the next or the previous record in the selected order.
Above the diagram you see a record number and the total number of records in the
memory. In the second line you find a VMID text if a VMID measuring point was
used and a text entered (see section 6.3.2). If no text was entered you will see here
the VMID code or “No ID”.
To measure the spectral lines the cursor can be moved along using the ◄► keys.
The red pointer below the diagram marks the cursor position. The currently mea-
sured spectral line is highlighted red. The frequency and amplitude are also dis -
played below the diagram.
Press F1 to delete the displayed spectrum from the memory.
Saved Spectra can also be transferred via USB to the PC (see section 13.3).
24
Figure 33: FFT memory


