page 22
pr
ogr
amming
mikroICD
™
- In Circuit Debugger
What is Debugging?
Every developer comes to a point where he has to monitor the
code execution in order to find errors in the code, or simply
to see if everything is going as planed. This hunt for bugs or
errors in the code is called
debugging
. There are two ways
to do this: one is
the software simulation
, which enables
you to simulate what is supposed to be happening on the
microcontroller as your code lines are executed and the other,
most reliable one, is monitoring the code execution on the
MCU itself. And this latter one is called
In-Circuit debugging
.
"In-Circuit" means that it is the real deal - code executes right
on the target device.
What is mikroICD
™
?
The on-board
mikroProg
™
programmer supports
mikroICD
™
- a
highly effective tool for a
Real-Time debugging
on hardware
level. The mikroICD
™
debugger enables you to execute your
program on the host PIC microcontroller and view variable
values, Special Function Registers (SFR), RAM, CODE and
EEPROM memory along with the mikroICD
™
code execution
on hardware. Whether you are a beginner, or a professional,
this powerful tool, with intuitive interface and convenient
set of commands will enable you to track down bugs quickly.
mikroICD
™
is one of the fastest, and most reliable debugging
tools on the market.
Supported Compilers
All MikroElektronika compilers,
mikroC
,
mikroBasic
and
mikroPascal
for PIC®, dsPIC® and PIC32® natively support
mikroICD
™
. Specialized mikroICD DLL module allows compilers to
exploit the full potential of fast hardware debugging. Along with
compilers, make sure to install the appropriate
programmer
drivers
and
mikroProg Suite for PIC®
programming software,
as described on
pages 20
and
21.
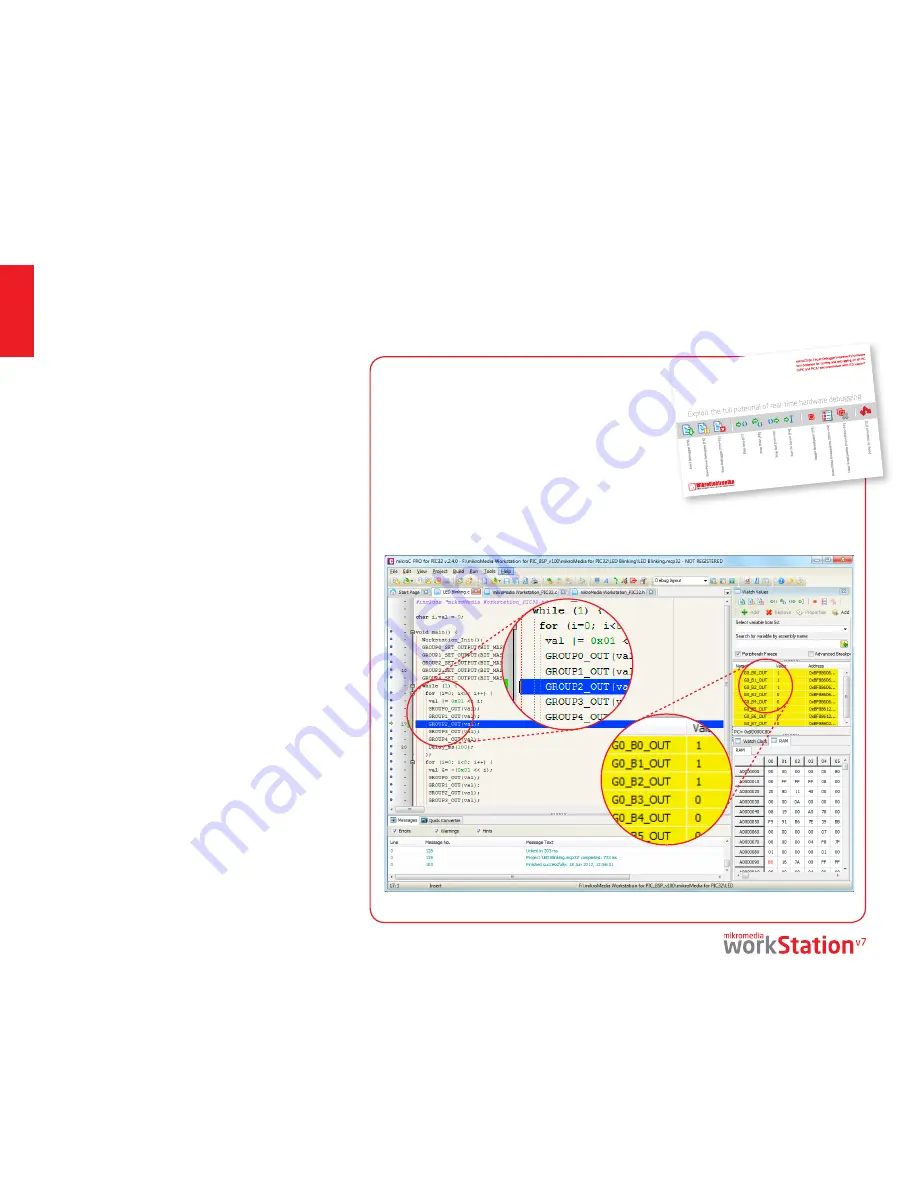
When you build your project for debugging, and program
the microcontroller with this HEX file, you can start the
debugger using
[F9]
command. Compiler will change layout
to debugging view, and a blue line will mark where code
execution is currently paused. Use
debugging toolbar
in
the
Watch Window
to guide the program execution, and stop
anytime. Add the desired variables to Watch and monitor their
values. Complete guide to using mikroICD
™
with your compiler
is provided within the mikromedia
™
workStation v7 package.
How do I use the debugger?
Figure 5-4: mikroC PRO for PIC32® compiler in debugging view, with SFR registers in Watch Window
Figure 5-3: mikroICD
™
manual
explains debugging thoroughly
mikro
ICD
™
in-circuit debugger


