10
EasyPIC6 Development System
MikroElektronika
page
4.0. mikroICD (In-Circuit Debugger)
The mikroICD (In-Circuit Debugger) is an integral part of the on-board programmer. It is used for the purpose of testing and debugging
programs in real time. The process of testing and debugging is performed by monitoring the state of all registers within the microcontroller
while operating in real environment. The mikroICD software is integrated in all compilers designed by mikroElektronika (mikroBASIC
®
,
mikroC
®
and mikroPASCAL
®
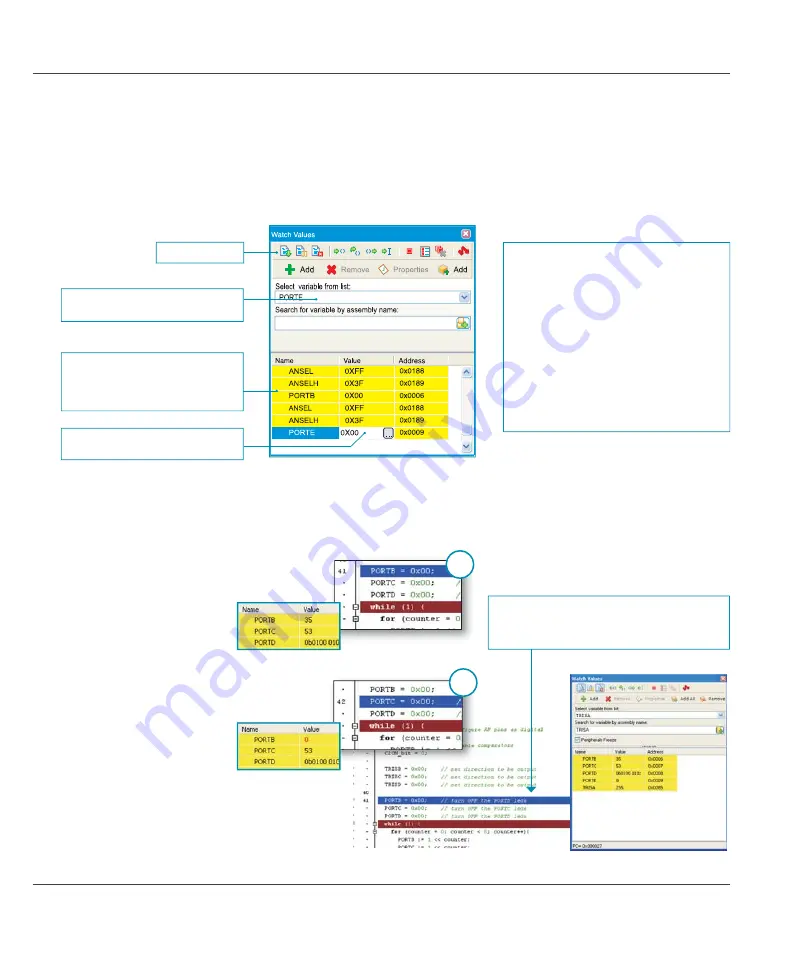
$VVRRQDVWKHPLNUR,&'GHEXJJHUVWDUWVXSDZLQGRZDVVKRZQLQ¿JXUHEHORZDSSHDUV
The
mikroICD
debugger communicates with the PC through the programming pins which cannot be used as I/O pins while the process of
the program debugging is in progress.
127(
For more information on the mikroICD debugger refer to the
PLNUR,&''HEXJJHU
manual.
Icon commands
A list of selected registers to be moni-
tored. The state of these registers
changes during the program execution,
which can be viewed in this window
A complete list of registers within the
programmed microcontroller
Double click on the
9DOXH
¿HOG
enables you to change data format
During operation, the program line to be executed next is
highlighted in blue, while the breakpoints are highlighted in
red. The
Run
command executes the program in real time
until it encounters a breakpoint.
Figure 4-1
: mikroICD Watch Values window
6WHS
In this example the 41st program
line is highlighted in blue, which
means that it will be executed
next. The current state of all
registers within the microontroller
can be viewed in the mikroICD
:DWFK9DOXHV
window.
6WHS
After the
6WHS2YHU
command is
executed, the microcontroller will
execute the 41st program line.
The next line to be executed is
highlighted in blue. The state
of registers being changed by
executing this instruction may
be viewed in the
:DWFK 9DOXHV
window.
The mikroICD debugger also offers functions such as running a program step by step (single stepping), pausing the program execution
to examine the state of currently active registers using breakpoints, tracking the values of some variables etc. The following example
illustrates a step-by-step program execution using the
6WHS2YHU
command.
Start Debugger
[F9]
Run/Pause Debugger
[F6]
Stop Debugger
[Ctrl+F2]
Step Into
[F7]
Step Over [F8]
Step Out
[Ctrl+F8]
Toggle Breakpoint
[F5]
Show/Hide Breakpoints
[Shift+F4]
Clear Breakpoints
[Ctrl+Shift+F4]
Each of these commands is activated via
keyboard shortcuts or by clicking appropriate
icon within the
:DWFK9DOXHV
window.
PLNUR,&'GHEXJJHURSWLRQV
1
2


