Page 34
Appendix | Measurement on Spheres and Shafts
capaNCDT 61x4
i
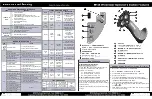
The figures show examples of the effect on a CS05 sensor at different distances between the sensor and target and with dif-
ferent target widths. The results are based on our own simulations and calculations; please ask if you would like more detailed
information.
A 4
Measurement on Spheres and Shafts
0.0%
2.0%
4.0%
6.0%
8.0%
10.0%
12.0%
14.0%
16.0%
R
elative
deviation [%
of MR
]
Target distance (inner width), [% of MR]
Ball-Ø30 mm CS1
Ball-Ø40 mm CS02
Ball-Ø40 mm CS1
10 % 20 %
30 %
40 %
50 %
60 %
70 %
80 %
90 %
100 %
Ball-Ø30 mm CS02
Cylinder Ø30 mm CS1
Cylinder Ø40 mm CS02
Cylinder Ø40 mm CS1
Target distance (inner width), [% of MR]
10 % 20 %
30 %
40 %
50 %
60 %
70 %
80 %
90 %
100 %
0.0%
1.0%
2.0%
3.0%
4.0%
5.0%
6.0%
7.0%
8,0%
R
elative deviation
[%
of MR
]
Cylinder Ø30 mm CS02
Fig. 23 Measurement deviation when measuring
spherical targets
Fig. 24 Measurement deviation when measuring
cylindrical targets
i
The figures show examples of the effect on CS02 and CS1 sensors at different distances between the sensor and target and
with different object diameters. The results are based on our own simulations and calculations; please ask if you would like more
detailed information.