Once printed, this document is no longer controlled
www.cesphn.org.au
Last updated October 2018
Page 6 of 7
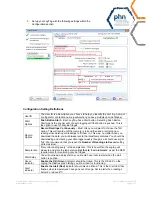
Analysing the report
There are four parts to the report:
1. Report
2. Graph
3. Data
4. Summary
By default, the graph will show first. The other sections can be accessed by clicking on the tabs at the
bottom of each page.
What to
look for
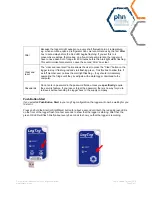
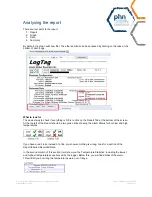
The easiest way to check if everything is OK is to click on the Report Tab at the bottom of the screen.
At the top left of the Report should be two green ticks showing the Alarm Status for both low and high
temperatures.
If you have a red cross, instead of a tick, you know something is wrong. Look for a section of the
Report labelled Recorded Data.
In the second column of this section it will show you the Temperature Statistics, including the lowest
and highest temperatures experienced by the logger. Below this, you will find details of the alarm.
This will tell you how long the temperatures were out of range.


