LTC3703-5
14
37035fa
appropriate breakdown specification. Since most MOSFETs
in the 30V to 60V range have logic level thresholds
(V
GS(MIN)
≥
4.5V), the LTC3703-5 is designed to be used
with a 4.5V to 15V gate drive supply (DRV
CC
pin).
For maximum efficiency, on-resistance R
DS(ON)
and input
capacitance should be minimized. Low R
DS(ON)
minimizes
conduction losses and low input capacitance minimizes
transition losses. MOSFET input capacitance is a combi-
nation of several components but can be taken from the
typical “gate charge” curve included on most data sheets
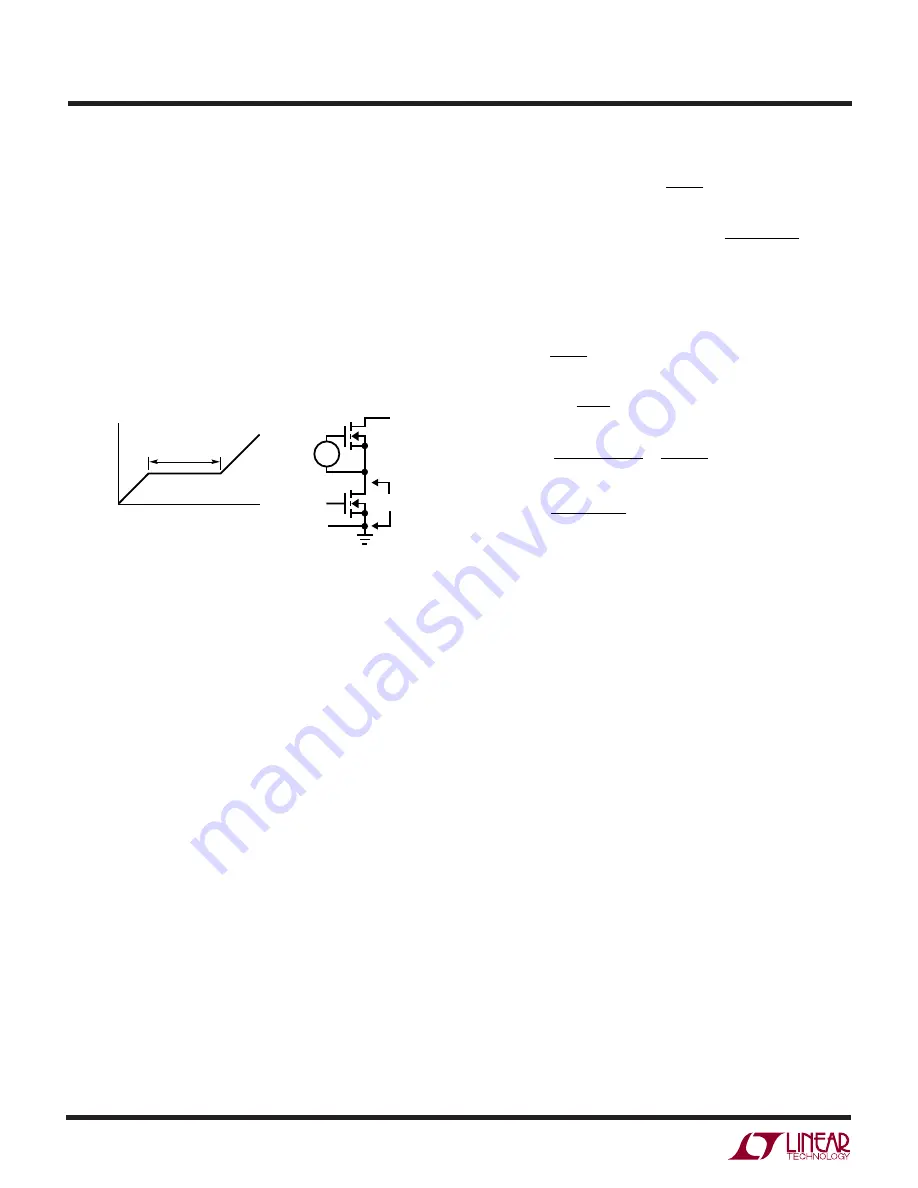
(Figure 8).
The curve is generated by forcing a constant input current
into the gate of a common source, current source loaded
stage and then plotting the gate voltage versus time. The
initial slope is the effect of the gate-to-source and the gate-
to-drain capacitance. The flat portion of the curve is the
result of the Miller multiplication effect of the drain-to-gate
capacitance as the drain drops the voltage across the
current source load. The upper sloping line is due to the
drain-to-gate accumulation capacitance and the gate-to-
source capacitance. The Miller charge (the increase in
coulombs on the horizontal axis from a to b while the curve
is flat) is specified for a given V
DS
drain voltage, but can be
adjusted for different V
DS
voltages by multiplying by the
ratio of the application V
DS
to the curve specified V
DS
values. A way to estimate the C
MILLER
term is to take the
change in gate charge from points a and b on a manufac-
turers data sheet and divide by the stated V
DS
voltage
specified. C
MILLER
is the most important selection criteria
for determining the transition loss term in the top MOSFET
but is not directly specified on MOSFET data sheets. C
RSS
and C
OS
are specified sometimes but definitions of these
parameters are not included.
When the controller is operating in continuous mode the
duty cycles for the top and bottom MOSFETs are given by:
APPLICATIO S I FOR ATIO
W
U
U
U
MainSwitchDutyCycle
V
V
SynchronousSwitchDutyCycle
V
V
V
OUT
IN
IN
OUT
IN
=
=
–
The power dissipation for the main and synchronous
MOSFETs at maximum output current are given by:
P
V
V
I
R
V
I
R
C
V
V
V
f
P
V
V
V
I
R
MAIN
OUT
IN
MAX
DR ON
IN
MAX
DR
MILLER
CC
TH IL
TH IL
SYNC
IN
OUT
IN
MAX
DS N
=
( )
+
+
+
⎡
⎣
⎢
⎢
⎤
⎦
⎥
⎥
=
+
2
2
2
0
1
2
1
1
1
(
)
(
)(
) •
–
( )
–
(
) (
)
(
)
( )
( )
(
)
δ
δ
where
δ
is the temperature dependency of R
DS(ON)
, R
DR
is
the effective top driver resistance (approximately 2
Ω
at
V
GS
= V
MILLER
), V
IN
is the drain potential
and the change
in drain potential in the particular application. V
TH(IL)
is the
data sheet specified typical gate threshold voltage speci-
fied in the power MOSFET data sheet at the specified drain
current. C
MILLER
is the calculated capacitance using the
gate charge curve from the MOSFET data sheet and the
technique described above.
Both MOSFETs have I
2
R losses while the topside N-channel
equation includes an additional term for transition losses,
which peak at the highest input voltage. For V
IN
< 25V, the
high current efficiency generally improves with larger
MOSFETs, while for V
IN
> 25V, the transition losses
rapidly increase to the point that the use of a higher
R
DS(ON)
device with lower C
MILLER
actually provides higher
efficiency. The synchronous MOSFET losses are greatest
at high input voltage when the top switch duty factor is low
or during a short circuit when the synchronous switch is
on close to 100% of the period.
The term (1 +
δ
) is generally given for a MOSFET in the
form of a normalized R
DS(ON)
vs temperature curve, and
typically varies from 0.005/
°
C to 0.01/
°
C depending on
the particular MOSFET used.
Figure 8. Gate Charge Characteristic
+
–
V
DS
V
IN
V
GS
MILLER EFFECT
Q
IN
a
b
C
MILLER
= (Q
B
– Q
A
)/V
DS
V
GS
V
+
–
37035 F08


