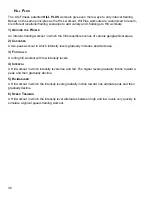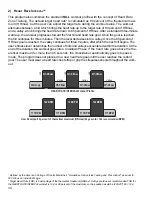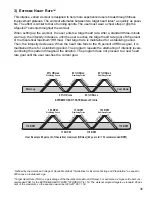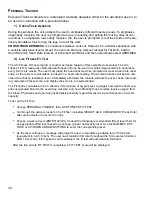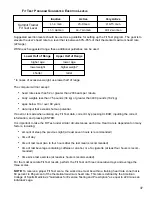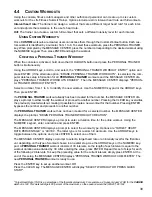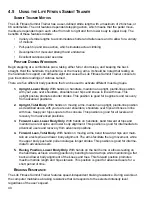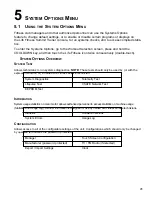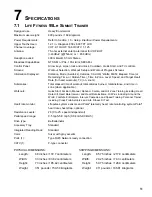
The tables below list fit test results.
R
ELATIVE
F
ITNESS
C
LASSIFICATION FOR
M
EN
Men
Estimated VO2 Max (ml/kg/min) Per Age Category
Rating
20-29
30-39
40-49
50-59
60+
Elite
52+
51+
48+
45+
42+
Excellent
50-51
48-50
46-47
42-44
39-41
Very Good
47-49
45-47
43-45
40-41
36-38
Above Average
44-46
42-44
40-42
37-39
33-35
Average
41-43
39-41
37-39
34-36
30-32
Below Average
38-40
36-38
34-36
31-33
27-29
Low
35-37
33-35
31-33
28-30
24-26
Very Low
<35
<33
<31
<28
<24
R
ELATIVE
F
ITNESS
C
LASSIFICATION FOR
W
OMEN
Women
Estimated VO2 Max (ml/kg/min) Per Age Category
Rating
20-29
30-39
40-49
50-59
60+
Elite
44+
42+
39+
35+
34+
Excellent
42-43
40-41
37-38
33-34
32-33
Very Good
39-41
37-39
35-36
31-32
30-31
Above Average
37-38
35-36
32-34
29-30
28-29
Average
34-36
32-34
30-31
27-28
25-27
Below Average
31-33
29-31
27-29
25-26
23-24
Low
28-30
27-28
25-26
22-24
20-22
Very Low
<28
<27
<25
<22
<20
Life Fitness developed this rating scale based on VO2 max percentile distributions referenced in
American
College of Sports Medicine's "Guidelines for Exercise Testing and Prescription"
(6th Ed. 2000). It is
designed to provide a qualitative description of a user's VO2 max estimation, and a means of assessing
initial fitness level and tracking improvement.
38


