


Operating
25
Oper
ating
2
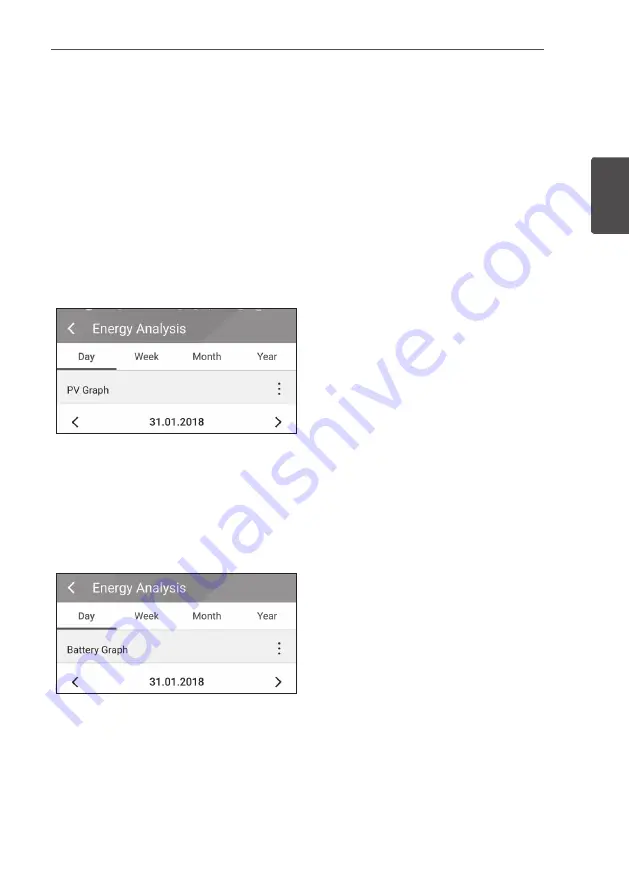
ESS Information Menu
Energy Analysis
On [Energy Analysis], you can check the statistical information of this system.
You can review the amount of energy generated, consumed, sold and purchased on this system.
The statistical data of the day, week, month and year are supported.
PV Graph
Analyzes the energy generated and sold from PV within selected period and displays as a graph.
Select [PV Graph] on [Energy Analysis].
Generated energy is marked with green and sold
energy is marked with purple on the line graph.
You can change the period by tapping [Day],
[Week], [Month] and [Year].
A
: Goes to previous [Day], [Week], [Month] or
[Year].
D
: Goes to next [Day], [Week], [Month] or
[Year].
Battery Graph
Analyzes the energy charged and discharged on the battery within selected period and displays as a
graph.
Select [Batt Graph] on [Energy Analysis].
Charged energy is marked with green, discharged
energy is marked with purple, and current status
of the battery is marked with yellow on the line
graph.
You can change the period by tapping [Day],
[Week], [Month] and [Year].
A
: Goes to previous [Day], [Week], [Month] or
[Year].
D
: Goes to next [Day], [Week], [Month] or
[Year].
Summary of Contents for D008KE1N211
Page 34: ...Using EnerVu 34 Using EnerVu 3 ...
Page 44: ......
Page 78: ...EnerVu benutzen 34 EnerVu benutzen 3 ...
Page 88: ......
Page 122: ...Utilisation de la fonction EnerVu 34 Utilisation de la fonction EnerVu 3 ...
Page 132: ......
Page 166: ...EnerVu gebruiken 34 EnerVu gebruiken 3 ...
Page 176: ......


