User Manual for BPS-2000
www.levitronix.com
PL-4021-00, Rev02, DCO# 15-235
8
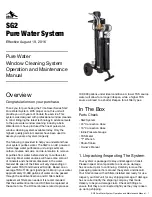
2.4 Pressure-Flow Curves
Figure 6: Pressure/flow curves
for “High Flow” pump head for aqueous solutions
(Measured with pump-head LPP-2000.6)
The linearly increasing cavitation
effects for the “High Flow” system for flows > 100 lpm and liquid
temperature range of 40
– 90
0
C was measured for water. This can be different for other liquids and depends
on the hydraulic circuit design. For example: higher inlet pressure reduces cavitation effects.
Figure 7
: Pressure/flow curves for “High Pressure” pump head for aqueous solutions
(Measured with pump-head LPP-2000.7)
The linearly increasing cavitation effects between 75-85 °
C for the “High Pressure” system have been
measured for water. This can be different for other liquids and depends on the hydraulic circuit design. For
example: higher inlet pressure reduces cavitation effects. For maximum static pressure limitation on
performance at temperatures > 70 °C consult specification under
Figure 10
.
0
10
20
30
40
50
60
0
5
10
15
20
25
30
35
0.0
0.5
1.0
1.5
2.0
2.5
3.0
3.5
4.0
4.5
0
20
40
60
80
100
120
140
[psi]
[gpm]
[bar]
[lpm]
Specific gravity = 1 g/cm
3
Viscosity = 0.7 cP
Liquid Temp.: 40
C
7000 rpm
6000 rpm
5000 rpm
8000 rpm
Standard Limit:
Speed Limit = 8000 rpm
Limits for 90
C Liquid:
Limits due to caviation
4000 rpm
0
10
20
30
40
50
60
70
80
90
100
0
2
4
6
8
10
12
14
16
18
20
22
0.0
1.0
2.0
3.0
4.0
5.0
6.0
7.0
0
10
20
30
40
50
60
70
80
[psi]
[gpm]
[bar]
[lpm]
Specific gravity = 1 g/cm
3
Viscosity = 0.7 cP
Liquid Temp.: 40
C
7000 rpm
6000 rpm
5000 rpm
8000 rpm
Standard Limits up to 75
C:
Speed Limit = 10000 rpm
Drive Current Limit: 11Arms
Limits for > 75
C Liquid:
(Cavitation and axial in-stability)
Limits for > 85
C Liquid
(Cavitation and axial in-stability)
4000 rpm
9000 rpm
10000 rpm