Measuring process
Power Analyzer NORMA 4000, NORMA 5000
47
EO1111G REV G
Note
The changing of the display size is done in a loop, every time you
press the function key
3/6/9
.
You can change the size in the configuration menu and also in the
measurement menu.
Save the settings with
SAVE
in the desired configuration
See details about saving a configuration in chapter 7.9 Save
configuration
Press function keys
Back...
or
Esc
The recently used numeric screen is shown.
8.3 Change view mode
After having selected a channel and the relevant measured values,
you have the option to change to different view modes where the
parameters are shown in the form of numerical values, vector
graphs or oscilloscope graphs.
8.3.1 Numerical
display
For details regarding the numerical display of measured values,
refer to chapter 8.2 "Measure voltage, current and power", page 40
8.3.2 Vector
graphs
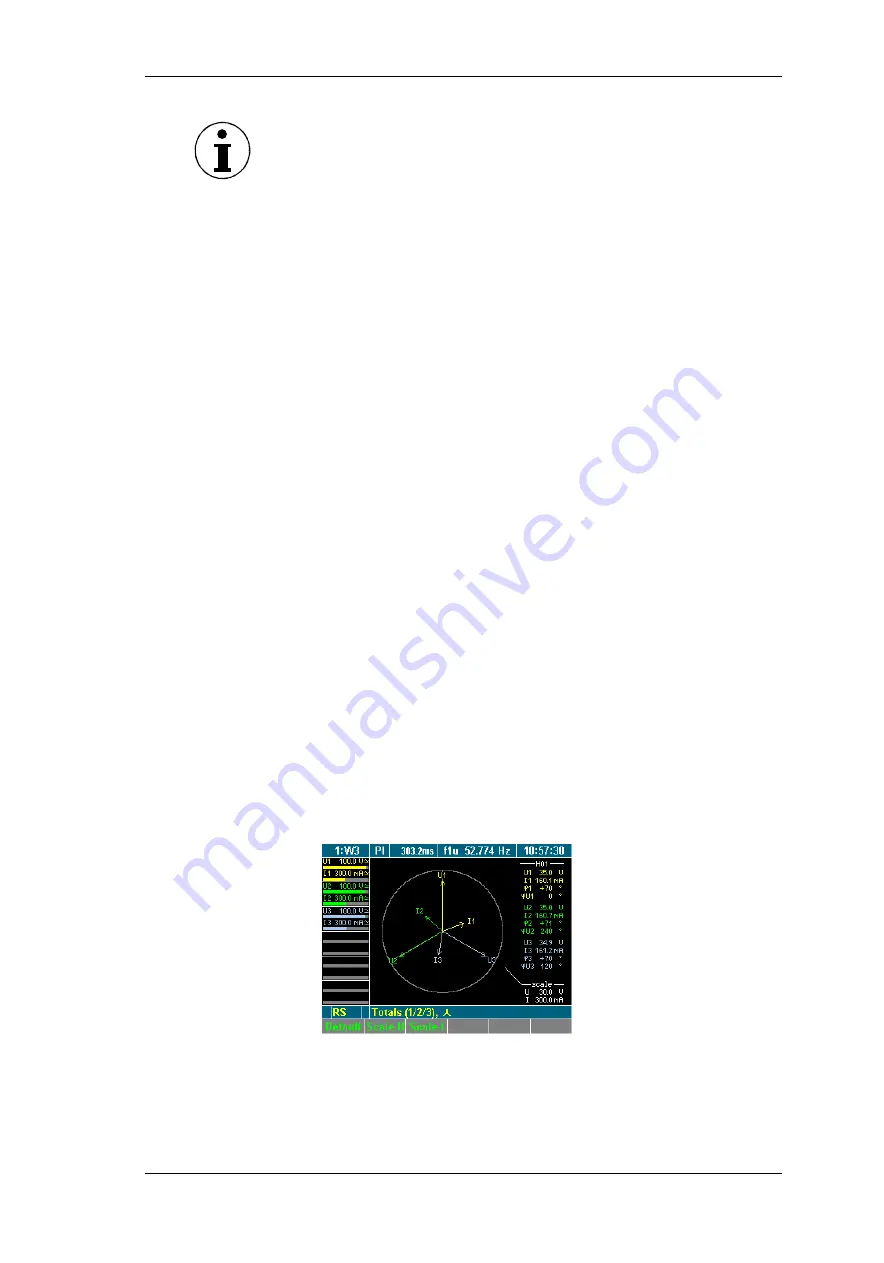
Up to 6 signals of the H01 fundamentals can be viewed as vector
graphs.
The vector graphs show voltage and current with amplitude and
phase shift, and allow fro the fast assessment of signals and
detection of errors in the connections.
Press measuring keys
∑
or
1...n
and
WAV
to call up the
desired values, e.g. values measured at
WAV power
.
Press measuring key
Vector graphs
.
The measured values are shown in the form of vector graphs.
Save user
defined screen
Back to common
numeric screen
View vector
graphs
All manuals and user guides at all-guides.com


