


Revision 2 Date: 15 Sep 2022 Page - 16 - of-20
Upon sucessful completion of all image acquisitions, analysis will begin and the results will be displayed
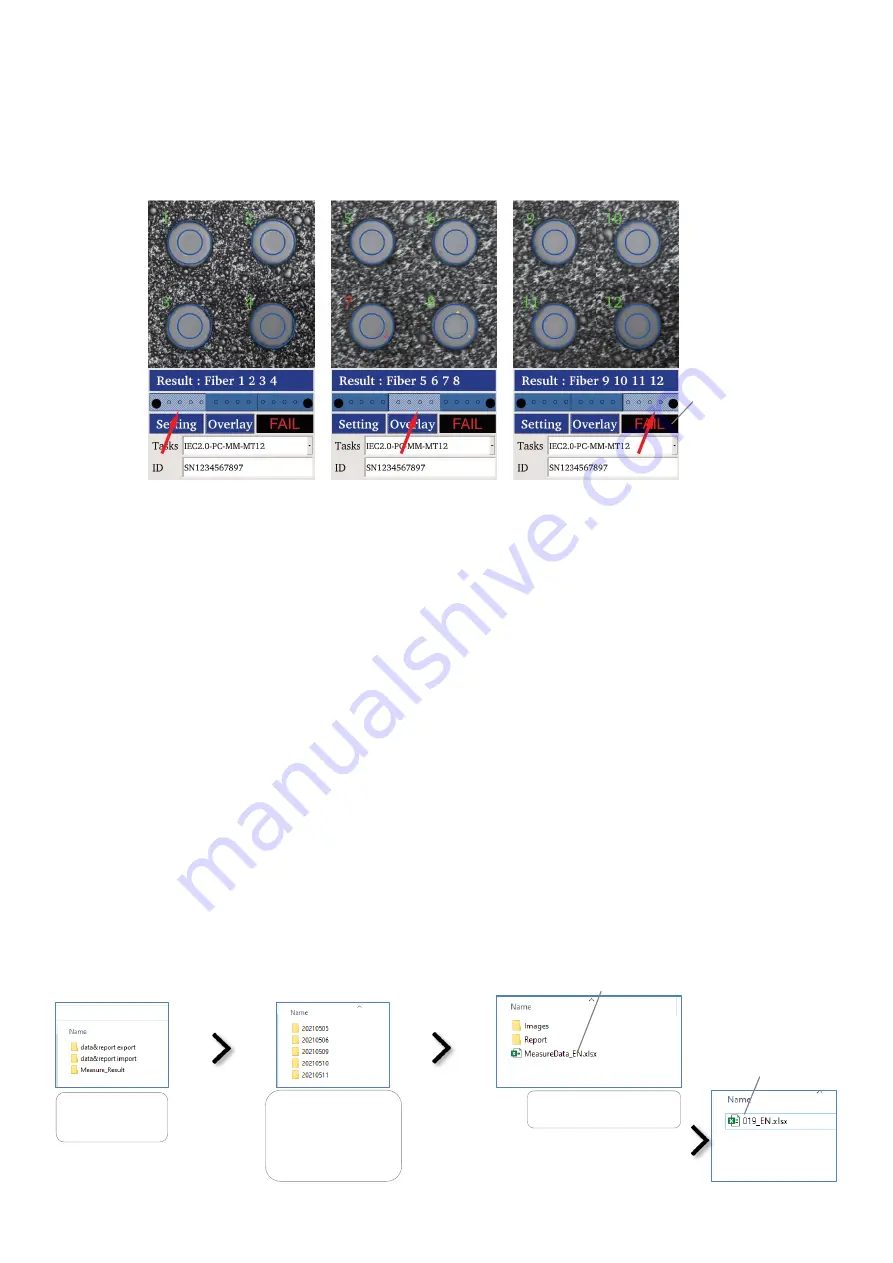
automatically.
Tap on the left-most bar (as shown below by the red arrow) to view analysis for fibers 1,2,3,4. Tap on the
middle bar for fibers 5,6,7,8. Tap on the right-most bar for fibers 9,10,11,12.
Note:
The following are important in ensuring succesful and accurate analysis results,
•
Image acquisition steps must be performed in the exact order as described above.
•
All images acquired are properly focused.
•
At any step of Image acquisitions, if prompted with error messages (such as “No fiber found”,
“Measurement failed”), tap “Redo” button to repeat.
7.4 Download data from instrument
Upon completion of a pass/fail analysis, image/data/report are automatically stored in the SD card in
instrument.
The file/directory can be deleted from instrument’s SD card via the USB connection.
To download these saved image/data/report, connect instrument to a PC using the supplied USB-C
cable. Once connected, the directories in the SD card is displayed automatically on PC as shown in the
examples below.
Overall analysis result
is shown here as PASS
or FAIL.
In addition, pass and
fail result is also shown
by a green and red
Status Indication LED
respectively (see Fig. 1
of section 6) on
instrument.
Click
“Measure
Data” folder
.
Click a folder named
with the latest date
to view the last saved
analysis data/report.
Excel Data file
Excel Report file
Click
on “Report” folder.


