22
Keysight N2791A/N2891A High-Voltage Differential Probes User Guide
N2891A Plots
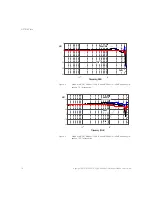
Figure 11
Graph of dB (S21) + 40 dB frequency response, 100:1 attenuation
Figure 12
Graph of dB (S21) + 60 dB frequency response, 1000:1 attenuation
10
0
10
2
10
4
10
6
10
8
-35
-30
-25
-20
-15
-10
-5
0
5
Frequency Hz
N
or
m
al
iz
ed
S
21
+
40dB
10
0
10
2
10
4
10
6
10
8
-16
-14
-12
-10
-8
-6
-4
-2
0
2
4
Frequency Hz
N
or
m
al
iz
ed
S
21
+
60d
B


