


Chapter 9: Qualification Study
Kaye ValProbe RT User Manual
87
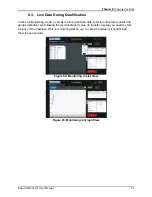
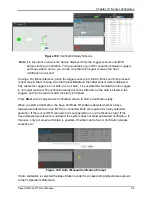
9.4. Graph Real-Time Sensor Readings and Calculations
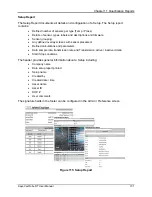
Figure 94: Graphing Sensor Readings
During qualification, data samples are displayed per the display rate.
To graph real-time sensor readings and calculations:
•
Press
Graph View
, to display the Graphs screen.
•
All the available Groups in that setup are displayed, when pressing the button for
each group, the corresponding graph is displayed.
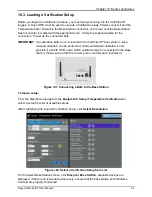
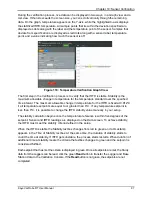
The
Setup
button displays the Setup review page that contains all parameters for
Qualification, Calibration and Verification. The page is similar to the setup review displayed on
the last step of the setup creation wizard.
Located next to
Setup
is the
Hardware
button.
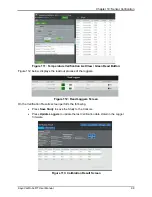
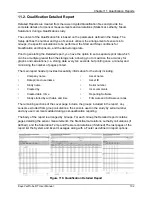
Figure 95: Hardware Screen
On the Hardware screen all available hardware connected to the ValProbe RT are available
including serial numbers and calibration dates. For review, press the device and a window with
data opens. The connected IRTD displays the current temperature value.
Summary of Contents for ValProbe RT
Page 1: ...Validation Kaye ValProbe RT User Manual MXXX EN Rev 1 0 May 2020 ...
Page 2: ... No content intended for this page ...
Page 4: ... No content intended for this page ...
Page 12: ......
Page 163: ...Kaye ValProbe RT User Manual 150 ...
Page 166: ... No content intended for this page ...


