

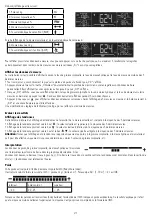


Measured data recall
The last 5 measurements can be recalled.
•
Switch on the scale by briefly stepping on the platform.
• Select the memory position in which your personal parameters are stored by pressing the “User” button several times. These then appear in turn
until the “0.0” display appears.
• As soon as “0.0” appears, you can recall the last data measured with the up button
.
• Press the up button
repeatedly to display the next older data. After a maximum of 5 measurements, the scale returns to the “0.0” display and
is ready for measurement.
If user settings are changed (e.g. age), the measured data memory is deleted.
Evaluation of results
Trend display (Trackersystem)
This scale hase a trend display, in which the value currently measured is compared with the averages of the last 5 measurements.
– Trend display up
: present value is higher than the average of the last 5 measurements.
– Trend display down
: present value is lower than the average of the last 5 measurements.
– Trend display up and down
: present value is the same as the average of the last 5 measurements.
Note that a trend is shown only for the body weight and the body fat, body water and muscle percentages and can be shown only when you have
stored at least 5 body fat percentages etc.
Interpretation
The weight values and the body fat, body water and muscle percentages are
interpreted with a bar in the evaluation graphic. When the values are low, the bar
is shown to the left (-). When the bar is in the middle area, the values are normal. While in the right-hand area (+) the values
are relatively high.
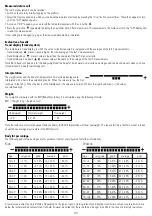
Weight:
Your weight is compared with the BMI (Body Mass Index). It is calculated using the following formula:
BMI = Weight in kg / (height in cm)² .
Underweight
Normal weight
Overweight
< 20
20 - 25
> 25
Note that with very muscular physiques (body builders), the BMI interpretation will show overweight. The reason for this is that no account is taken
of well above average muscle mass in the BMI formula.
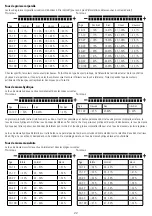
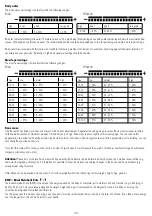
Body fat percentage
The following body fat percentages are for guidance (contact your physician for further information).
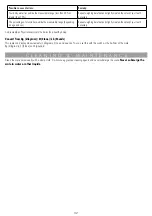
Man
Woman
Age
very good
good
average
poor
10-14
< 11%
11-16%
16,1-23%
> 23,1%
15-19
< 12%
12-17%
17,1-22%
> 22,1%
20-29
< 13%
13-18%
18,1-23%
> 23,1%
30-39
< 14%
14-19%
19,1-24%
> 24,1%
40-49
< 15%
15-20%
20,1-25%
> 25,1%
50-59
< 16%
16-21%
21,1-26%
> 26,1%
60-69
< 17%
17-22%
22,1-27%
> 27,1%
70-100
< 18%
18-23%
23,1-28%
> 28,1%
A lower value is often found in athletes. Depending on the type of sports, training intensity and physical constitution, values may result which are
below the recommended values stated. It should, however, be noted that there could be a danger to health in the case of extremely low values.
29
Age
very good
good
average
poor
10-14
< 16%
16-21%
21,1-26%
> 26,1%
15-19
< 17%
17-22%
22,1-27%
> 27,1%
20-29
< 18%
18-23%
23,1-28%
> 28,1%
30-39
< 19%
19-24%
24,1-29%
> 29,1%
40-49
< 20%
20-25%
25,1-30%
> 30,1%
50-59
< 21%
21-26%
26,1-31%
> 31,1%
60-69
< 22%
22-27%
27,1-32%
> 32,1%
70-100
< 23%
23-28%
28,1-33%
> 33,1%
Summary of Contents for PW 890 BG
Page 34: ...Notities Notizen Notes Notes 34...


