


6
SRL Series
6
Operation
3.4 Temperature Coeffi cient Constants
The change of resistance with temperature for each
standard is accurately expressed by the equation:
R
t
=R
23
[1+a(t-23)+ß(t-23)
2
]
R
t
=Resistance at (°C)
R
23
= Resistance at 23°C
a = Slope of the curve (ppm/°C) at 23°C
ß = Rate of change of slope of the curve (ppm/°C
2
)
The values of
a
and ß are given with each unit.
Experience shows that these values do not change
appreciably with time and hence need to be deter-
mined only once.
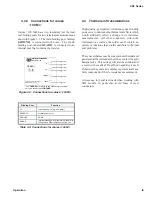
The resistance vs. temperature relationship is shown
in Figure 3-4. The value at any temperature may be
obtained from the above formula, or the temperature
calibration chart shown in Figure 3-5.
Figure 3-4: Resistance vs. temperature
relationship
Approximate Temperature (°C)
-3
-2.5
-2
-1.5
-1
-0.5
0
0.5
1
-0.5% -0.4% -0.3% -0.2% -0.1% 0.0% 0.1% 0.2% 0.3% 0.4% 0.5%
Figure 3-5: Temperature Calibration Chart
3.5 Environmental Conditions
3.5.1 Operating Temperature
For optimal accuracy, SRL Models should be used
in an environment of 23°C ±5°C. They should be
allowed to stabilize at those temperatures after any
signifi cant temperature variation. For determina-
tion of accuracy for other temperatures consult the
Temperature Calibration Chart provided with each
unit. The calculated resistance value is provided be-
tween 18°C and 28°C in 0.5°C increments. Figure
2-2 shows an example of this table.
3.5.2 Storage Temperature
The SRL Series should be maintained within the
storage temperature range of 0°C to 40°C to retain
its accuracy within the specifi ed limits.
3.6 Shipping and Handling
The SRL Series should not be exposed to any excessive
shock or temperature extremes. The option SRC-100, a
lightweight transit case capable of storing two SRL units,
is recommended for shipping or transporting the models.
JOS
19-Jun-2001
1.000 003 3
SRL-1
B2-9240246
0
-1.6E-07
-2.4E-08
3.0
2.9
2.1
1.9
2.7
2.6
2.4
2.3
3.4
3.3
3.2
3.1
3.5
3.5
3.6
3.6
3.6
3.6
3.5
1.000 002 1
1.000 003 5
1.000 003 5
1.000 003 4
1.000 003 4
3.5
3.4
1.000 001 9
1.000 003 3
1.000 003 2
1.000 003 1
1.000 003 0
1.000 002 9
1.000 002 7
1.000 002 6
1.000 002 4
1.000 002 3
1.000 003 5
1.000 003 5
1.000 003 6
1.000 003 6
1.000 003 6
1.000 003 6
28.0
26.0
26.5
27.0
27.5
24.0
24.5
25.0
25.5
22.0
22.5
23.0
23.5
20.0
20.5
21.0
21.5
18.0
18.5
19.0
19.5
Temperature Calibration Chart
Model:
SN:
Alpha:
Report No:
Beta:
Temperature
(°C)
Deviation from
Nominal
(ppm)
Measured value at 23°C:
Date:
By:
IET LABS, INC.
• (516) 334-5959
• (800) 899-8438
• 534 Main Street, Westbury, NY 11590
Traceable to NIST
Resistance
Summary of Contents for SRL Series
Page 17: ......


