


80
80
80
80 Section 6:
Section 6:
Section 6:
Section 6: Statistics Functions
Statistics Functions
Statistics Functions
Statistics Functions
File name: HP 12c+_user's guide_English_E_HDP0F12AE03_062608 - Modified.doc
Page: 80 of 213
Printed Date: 2021/6/16
Dimension: 14.8 cm x 21 cm
Linear Estimation
Linear Estimation
Linear Estimation
Linear Estimation
With two-variable statistical data accumulated in the statistics registers, you can
estimate a new
y-value
(
yˆ
) given a new
x-value
, and estimate a new
x-value
(
xˆ
)
given a new
y-value
.
To calculate
yˆ
:
1. Key in a new
x-value
.
2. Press
gR
.
To calculate
xˆ
:
1. Key in a new
y-value
.
2. Press
gQ
.
Example:
Example:
Example:
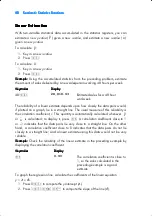
Example: Using the accumulated statistics from the preceding problem, estimate
the amount of sales delivered by a new salesperson working 48 hours per week.
Keystrokes
Keystrokes
Keystrokes
Keystrokes
Display
Display
Display
Display
48
gQ
28,818.93
Estimated sales for a 48 hour
workweek.
The reliability of a linear estimate depends upon how closely the data pairs would,
if plotted on a graph, lie in a straight line. The usual measure of this reliability is
the correlation coefficient,
r
. This quantity is automatically calculated whenever
yˆ
or
xˆ
is calculated; to display it, press
~
. A correlation coefficient close to 1
or –1 indicates that the data pairs lie very close to a straight line. On the other
hand, a correlation coefficient close to 0 indicates that the data pairs do not lie
closely to a straight line; and a linear estimate using this data would not be very
reliable.
Example:
Example:
Example:
Example: Check the reliability of the linear estimate in the preceding example by
displaying the correlation coefficient.
Keystrokes
Keystrokes
Keystrokes
Keystrokes
Display
Display
Display
Display
~
0.90
The correlation coefficient is close to
1, so the sales calculated in the
preceding example is a good
estimate.
To graph the regression line, calculate the coefficients of the linear equation
y
=
A
+
Bx
.
1. Press 0
gR
to compute the
y-
intercept (
A
).
2. Press 1
gR~d~-
to compute the slope of the line (
B
).
Summary of Contents for 0012C-90001
Page 1: ...hp 12c financial calculator user s guide H Edition 5 HP Part Number 0012C 90001 ...
Page 14: ......
Page 15: ...Part I Part I Part I Part I Problem Solving Problem Solving Problem Solving Problem Solving ...
Page 86: ......
Page 87: ...Part II Part II Part II Part II Programming Programming Programming Programming ...
Page 123: ...Part III Part III Part III Part III Solutions Solutions Solutions Solutions ...
Page 169: ...Appendi Appendi Appendi Appendixes xes xes xes ...


