Performance and curves diagrams
Domestic air conditioner
11.Performence and curves diagrams
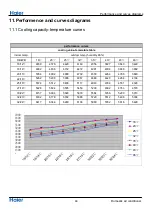
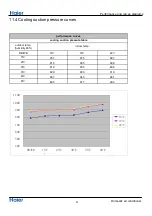
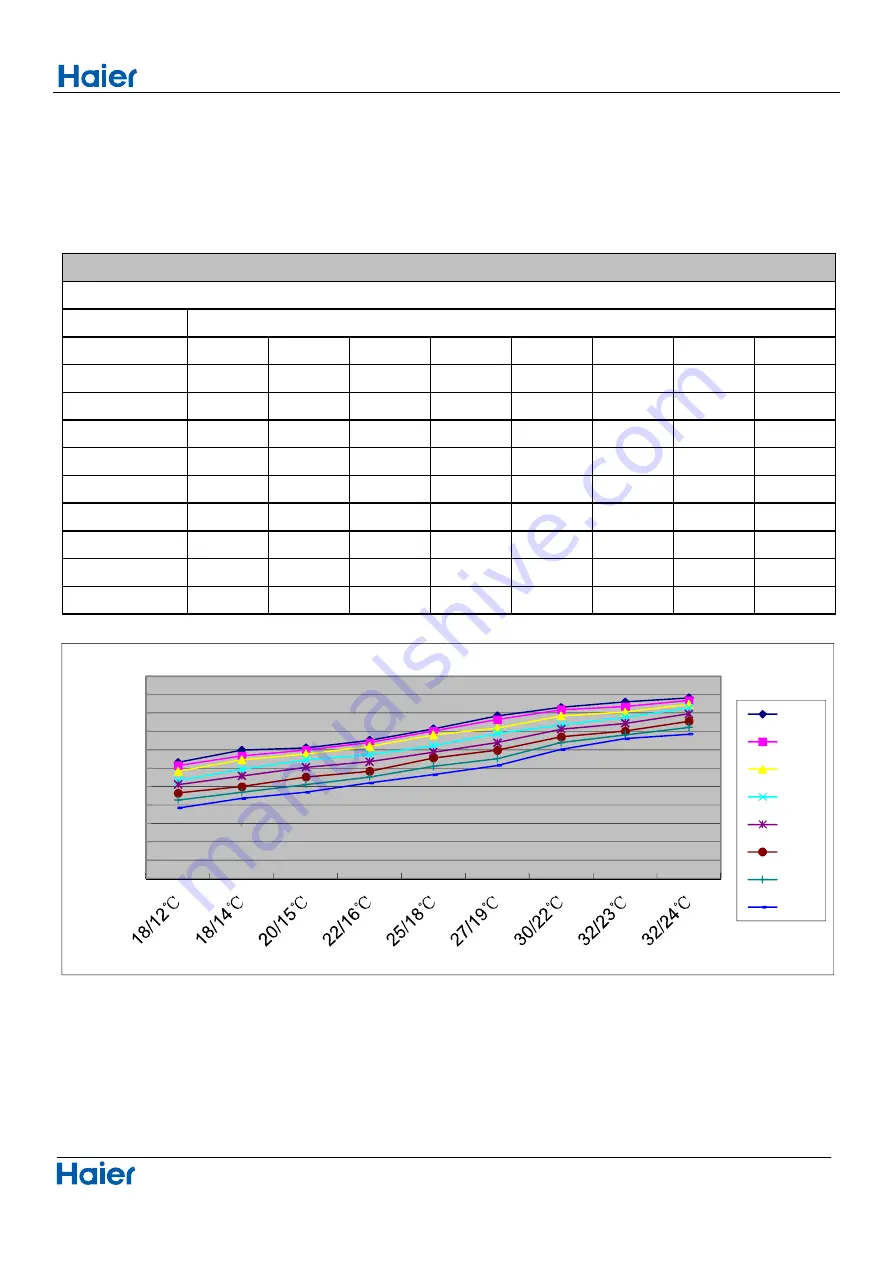
11.1 Cooling capacity-temperature curves
48
indoor temp.
DB/WB
18
℃
20
℃
25
℃
32
℃
35
℃
40
℃
43
℃
46
℃
18/12
℃
4659
4576
4420
4160
4056
3827
3640
3422
18/14
℃
4992
4836
4732
4472
4291
4004
3848
3682
20/15
℃
5054
4992
4888
4732
4530
4264
4056
3848
22/16
℃
5262
5200
5096
4867
4680
4420
4264
4104
25/18
℃
5574
5512
5408
5117
4940
4784
4551
4326
27/19
℃
5928
5824
5595
5450
5200
4992
4763
4576
30/22
℃
6157
6094
5928
5678
5564
5356
5200
5013
32/23
℃
6302
6178
6032
5886
5720
5512
5408
5304
32/24
℃
6417
6344
6240
6136
5980
5782
5616
5429
outdoor temp.(humidity 46%)
cooling value-temerature table
performance curves
1500
●
2000
2500
3000
3500
4000
4500
5000
5500
6000
6500
7000
18
℃
20
℃
25
℃
32
℃
35
℃
40
℃
43
℃
46
℃
Summary of Contents for 1U18REJFRA
Page 11: ...Pinping diagrams Domestic air conditioner 4ˊPiping diagrams 9 EEV EEV ...
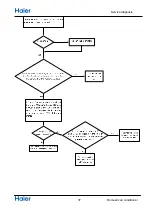
Page 12: ...Operation range Domestic air conditioner 5 Operation range 10 10 0 21 27 35 20 40 60 43 20 40 ...
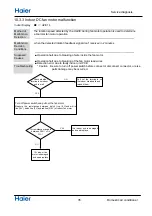
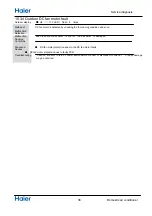
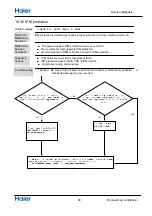
Page 39: ...Service diagnosis 37 Domestic air conditioner ...
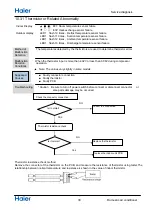
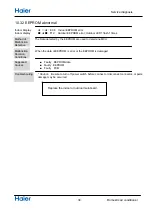
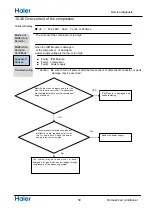
Page 46: ...Service diagnosis 44 Domestic air conditioner ...

