46
View Menu
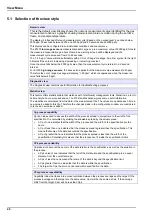
5.1 Selection of the view style
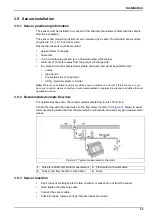
Numeric view
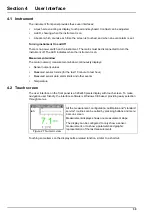
This is the default view. Display shows the numeric measurement value identified for the gas
measurement channel, a graphic showing measurement value evolution during the set time
frame, and sample temperature.
The display is refreshed after each measurement cycle (Based on the oxygen level: 2 seconds below
2000 ppb, 30 seconds between 2000 and 3000 ppb and 60 seconds above 3000 ppb).
This display can be configured to suit individual conditions and convenience.
The K1200
low range sensors
measure dissolved oxygen up to a maximum value of 5000 ppb. Should
the measured concentration go above this value a warning screen will be displayed and the
measurement cycle increased from 2 to 60 seconds.
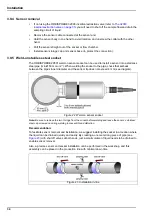
The “> 5.0 ppm” value will blink alternately with an “Out of range” message. An arrow symbol to the right
indicates if the value is increasing, decreasing or remaining constant.
Once the value falls below the 5000 ppb value, then the measurement cycle returns to a 2 second
interval.
For K1200
high range sensors
, the above also applies but the maximum value measured is 40 ppm.
Therefore the out of range message will display “> 40 ppm” which is suppressed when the measured
value falls below 40 ppm.
Diagnostic view
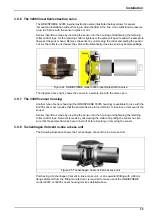
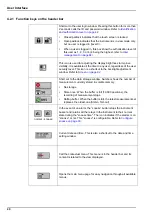
The diagnostic view contains useful information for troubleshooting purposes.
Statistic view
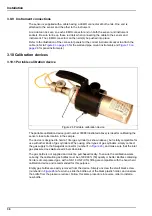
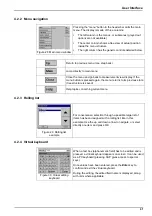
This feature offers statistical data that matches with Total Quality management tools. Statistics is a tool to
better analyze how a process behave. The 510 statistics window gives some useful information.
The statistics are calculated from the data in the measurement file. The values are updated each time a
new value is added to this file. Therefore the changes made in the configuration window are considered
only once a new value is added.
Cp process capability
Cp is an index used to assess the width of the process spread in comparison to the width of the
specification. It is calculated by dividing the allowable spread by the actual spread.
•
A Cp of one indicates that the width of the process and the width of the specification are the
same.
•
A Cp of less than one indicates that the process spread is greater than the specification. This
means that some of the data lies outside the specification.
•
A Cp of greater than one indicates that the process spread is less than the width of the
specification. Potentially this means that the process can fit inside the specification limits
CPk process variability
Cpk takes into account the center of the data relative to the specifications, as well as the variation in
the process.
•
A Cpk value of one indicates that the tail of the distribution and the specification are an equal
distance from the overall average.
•
A Cpk of less than one means that some of the data is beyond the specification limit.
•
A Cpk greater than one indicates that the data is within the specification.
•
The larger the Cpk, the more central and within specification the data.
CPm process repeatability
Capability index that takes into account variation between the process average and the target. If the
process average and the target are the same value, Cpm will be the same as Cpk. If the average
drifts from the target, Cpm will be less than Cpk.
Summary of Contents for ORBISPHERE K1200
Page 5: ...4 Table of Contents...
Page 13: ...12 General Information...
Page 39: ...38 Installation...
Page 45: ...44 User Interface...
Page 46: ...45 Section 5 View Menu Figure 34 View menu...
Page 49: ...48 View Menu...
Page 59: ...58 Calibration Menu...
Page 60: ...59 Section 8 Inputs Outputs Menu Figure 40 Inputs Outputs menu...
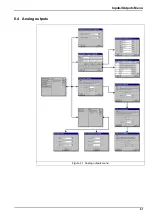
Page 62: ...61 Inputs Outputs Menu 8 4 Analog outputs Figure 41 Analog outputs menu...
Page 69: ...68 Inputs Outputs Menu...
Page 86: ...85 Section 11 Products Menu Figure 44 Products menu...
Page 89: ...88 Global Configuration Menu...
Page 90: ...89 Section 13 Services Menu Figure 46 Services menu Part 1...
Page 91: ...90 Services Menu Figure 47 Services menu Part 2...


