


DazScope
manual
Chapter 5 : Theory
1
0.1
0.2
0.3
0.4
0.5
0.6
0.7
0.8
0.9
6000
-6000
-4000
-2000
0
2000
4000
Added second order (fs^2
)
N
o
rm
a
liz
e
d
S
H
G
s
ig
n
a
l
in
te
n
s
it
y
a
t
7
4
5
T
H
z
1
0.1
0.2
0.3
0.4
0.5
0.6
0.7
0.8
0.9
6000
-6000
-4000
-2000
0
2000
4000
Added second order (fs^2
)
N
o
rm
a
liz
e
d
S
H
G
s
ig
n
a
l
in
te
n
s
it
y
a
t
7
4
5
T
H
z
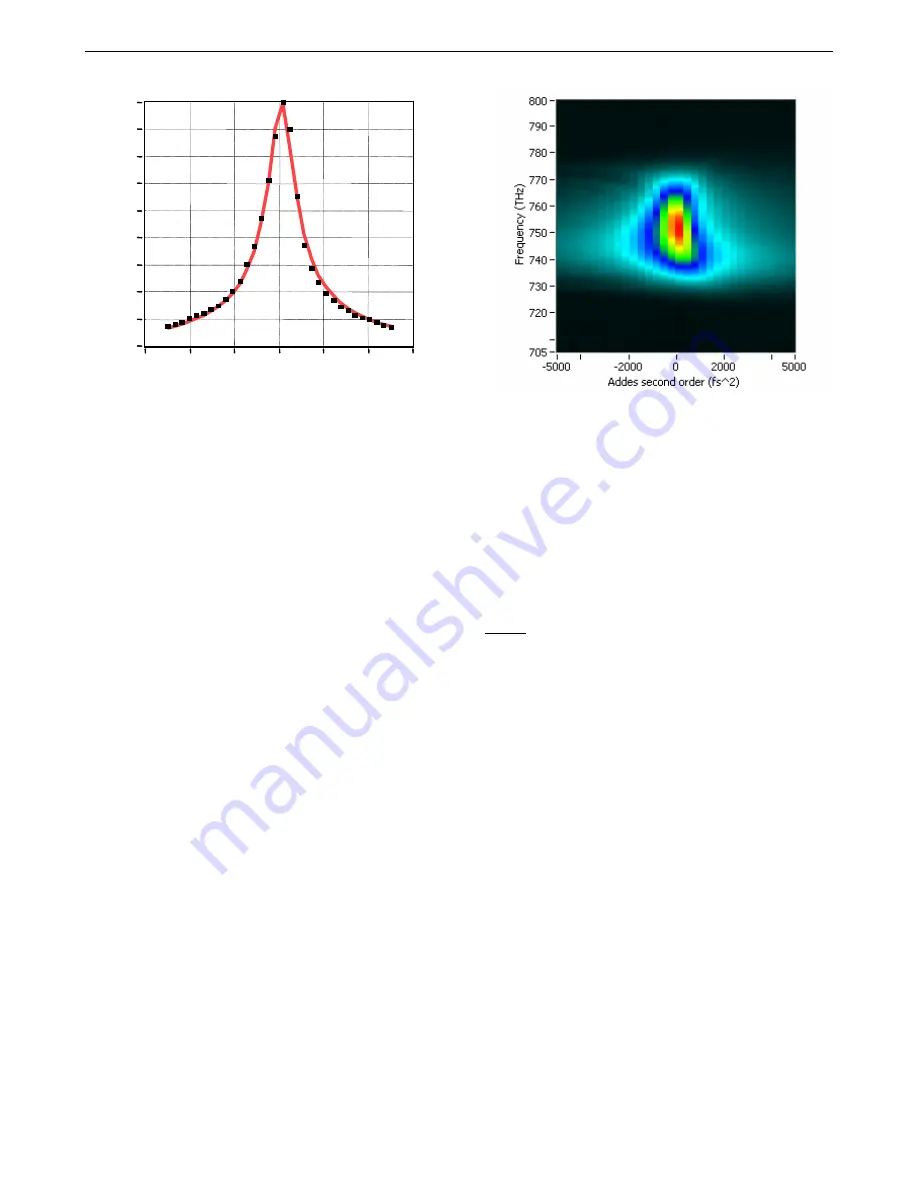
Figure 5.1: Left: map of SHG spectra as a function of frequency and added second order phase
coefficient. Right: typical Lorentzian fit (dotted line) to the experimental data (solid line) at a
given wavelength.
The validity of
can be confirmed by recording the SHG spectrum of a near Fourier-
transform limited pulse to which a purely parabolic phase
φ
2
(
ω
−
ω
0
)
2
/
2 is added. In this case,
the asymptotic expression of the SHG spectrum is a hyperbolic function of the second order phase
coefficient
φ
2
since the expected SHG spectrum is, according to
I
SHG
(2
ω
)
∝
I
2
(
ω
)
|
φ
2
|
(5.2)
shows some typical experimental SHG signal recorded at a given pulsation as a func-
tion of a programmed second order phase coefficient introduced by an AOPDF pulse shaper. A
Lorentzian fit confirms the validity of
, hyperbolic at large chirps.
Thanks to the asymptotic behavior of the SHG spectrum for high chirps, it is possible to retrieve
analytically the second derivative of the spectral phase from only a few experimental measurements.
For a given pulse of spectral phase
ϕ
(
ω
), we successively add to the pulse a ramp of frequency
chirps of varying second order coefficients
ϕ
2
. For every value of
ϕ
2
, the SHG spectrum
I
SHG
(
ω, ϕ
2
)
is recorded. At the end of the acquisition, the software fits, for every measured pulsation, the
experimental data
I
SHG
(
ω, ϕ
2
) with a reference function and retrieves
ϕ
00
(
ω
). An adequate weight
function is used to ignore the values measured at small chirps, in order to fit only the hyperbolic
decrease of the experimental data.
5.2
Examples
To illustrate the efficiency and accuracy of this method, we compare the SHG spectrum obtained
for a chirp scan from
−
3 000fs
2
to +3 000fs
2
onto four different optical pulses:
•
one Fourier transform (ie purely linear spectral phase) (
•
one with a pure second order only +1 000fs
2
FASTLITE-9 september 2008


