Model EA15 Version 1.5 9/03
6
SAVE FILE ICON
The SAVE FILE icon is the first icon on the left (floppy disk symbol). Click on this icon to
save recorded data to a text file. When clicked, the PC will prompt for a filename and
location. Once saved, this file can be opened in other programs such as spreadsheets,
word processors, and databases.
OPEN FILE ICON
The OPEN FILE icon is located second from left. Click to open a file that has already been
saved.
DATA LIST ICON
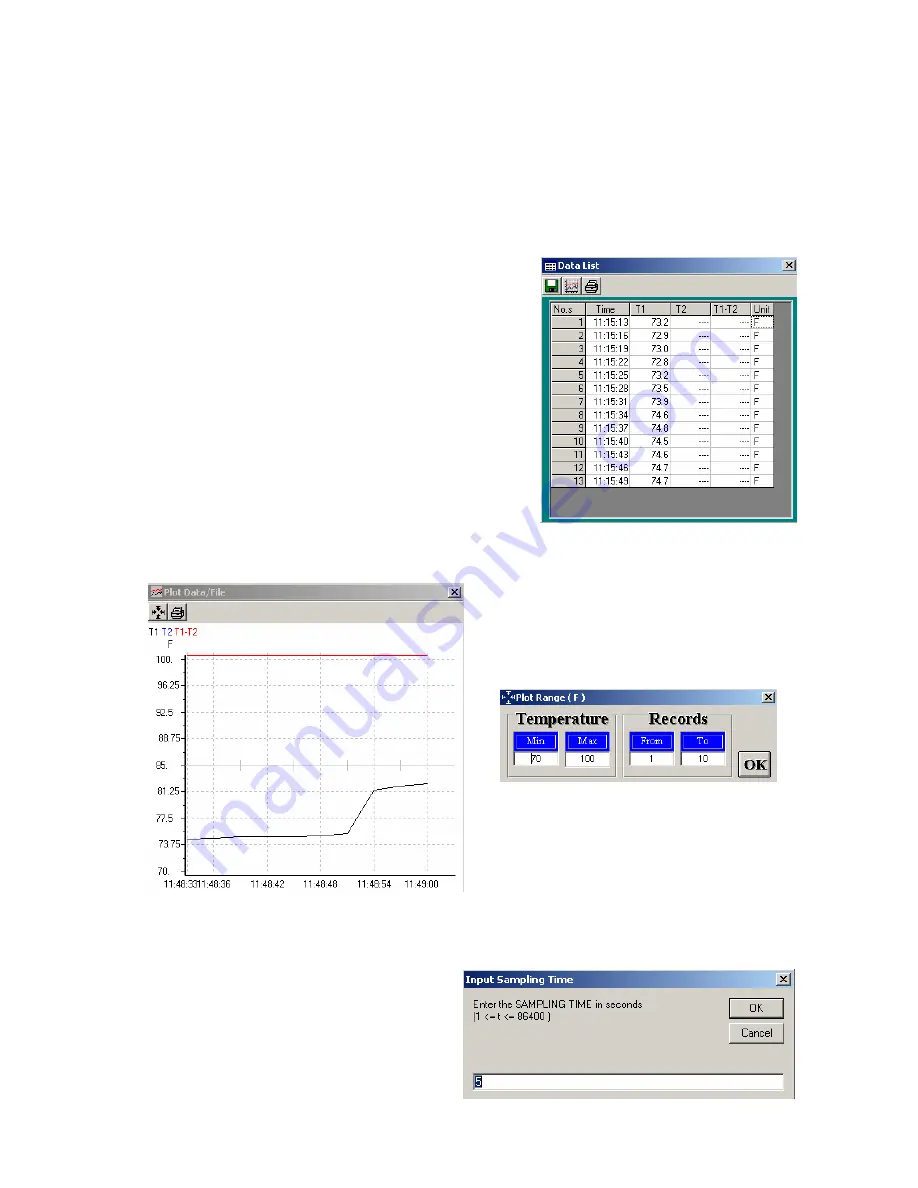
The LIST icon is located third from left on the main
software screen. When clicked, data is shown on
the screen in list format (shown at right). To save,
graph, or print the list, click the SAVE, GRAPH, or
PRINT icons in the Data List window.
DATA GRAPH ICON
The GRAPH icon is located fourth from left. When
clicked, the data is shown on an x-y graph (see
diagram below). The vertical axis represents the temperature units; the horizontal axis
represents the time.
Click on the PRINT to get a hard copy of the
graph. Press the four-arrow icon (next to the
PRINT icon) to change the scale and to
select data range to be viewed. See
diagram below
SAMPLING INTERVAL
The INTERVAL icon (2nd icon from right) allows the user to change the number of
seconds that the meter waits before
logging a reading. If the interval is set to
5 seconds, the meter will record a
reading every 5 seconds, for example.
The range is 1 to 86,400 seconds.


