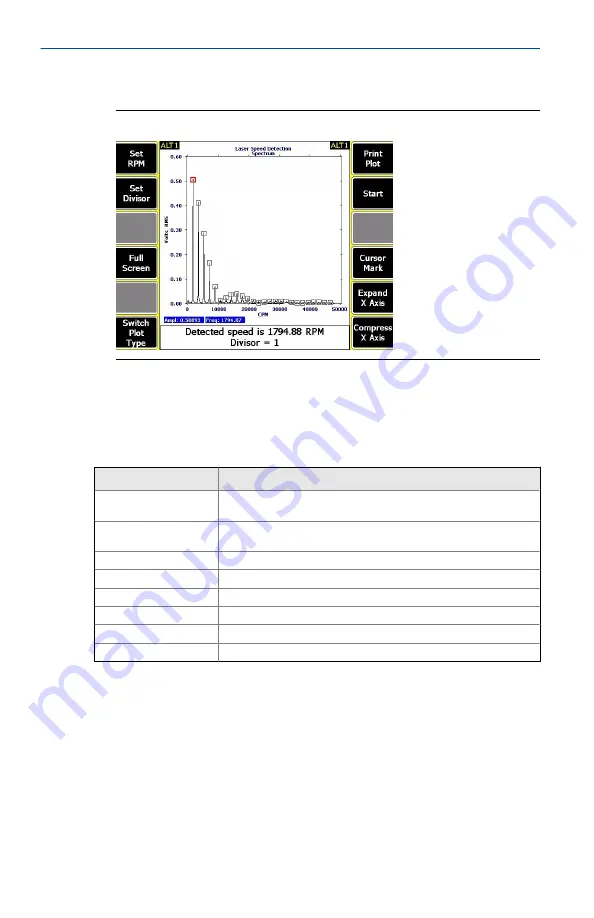
The speed is automatically set and displayed at the bottom of the screen.
Laser Speed Detection Spectrum screen
Figure 3-2:
3.2
Plot options
After you collect the data, the Route and Analyze programs display the
following keys to help you work with the data in the plot.
Option
Description
F1 Set RPM
(Analyze program only) Return to the Analyze main menu. It does not
store the RPM.
F2 Set Divisor
Divide the original marked peak by the number entered, and then
mark the new peak.
F4 Full Screen
View a full screen version of the plot.
F6 Switch Plot Type
Select a spectrum or waveform plot.
F8 Start
Select an estimated speed range and begin the measurement.
F10 Cursor Mark
Mark a frequency and display the speed at that point on the screen.
F11 Expand X Axis
Expand the axis on the data plot.
F12 Compress X Axis
Compress the axis on the data plot.
3.3
Detect turning speed for a variable-speed route point set
up for FPM
1. From the analyzer Home screen, press
F8 Route
.
2. Activate a route.
3. From the Route Data Collection screen, press
F12 Laser Speed Detection
from a variable-speed route point.
4. Press
Enter
.
August 2018
User Guide
19


