25
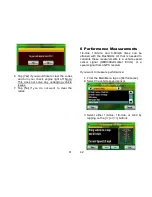
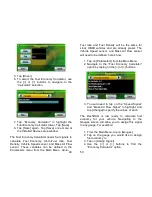
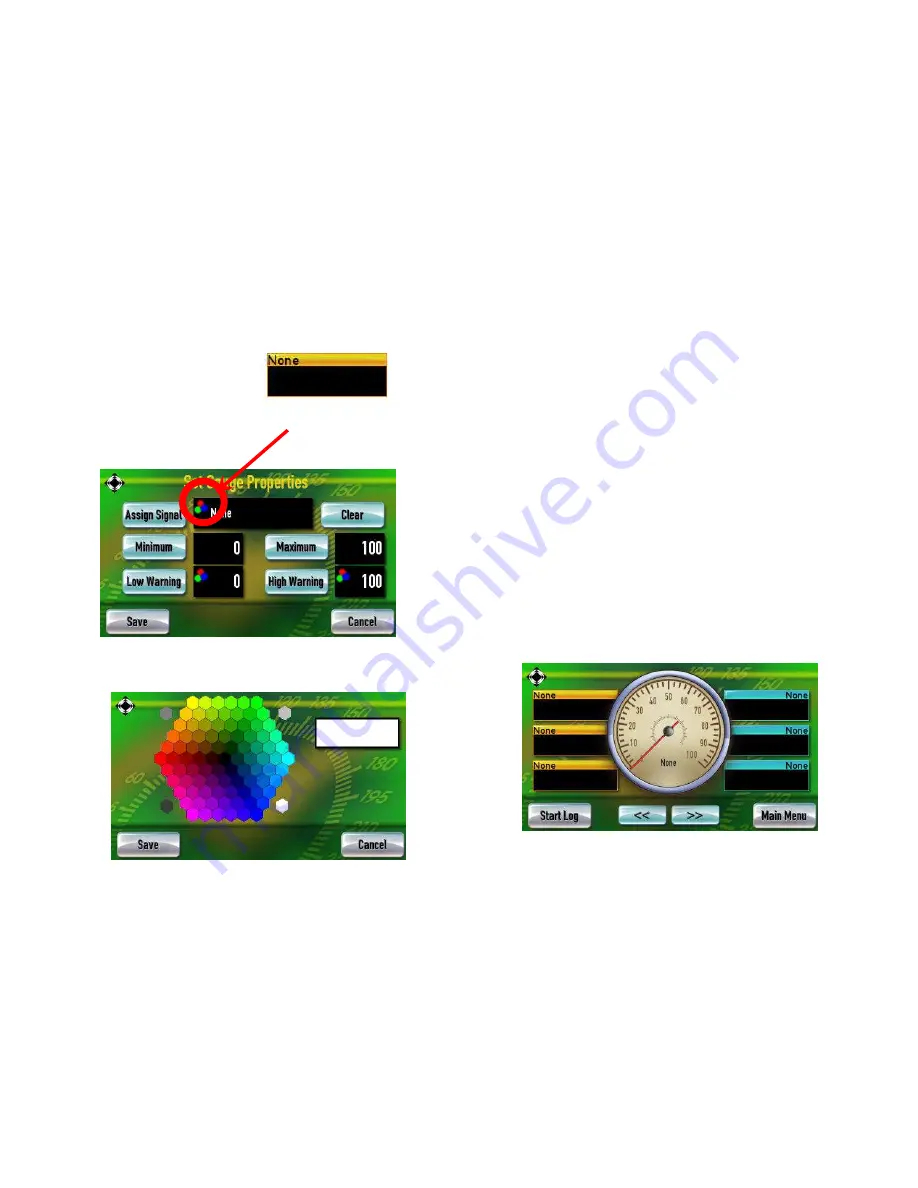
The DashDAQ allows users to assign different
colors to the signals assigned to a particular
gauge. The signal will be displayed in the color
chosen. To change color values:
1. Tap on a signal box
.
2. Tap on the red, green, and blue swatch in the
corner of the box.
3. Now tap on the color to select. Tap [Save].
4. Tap [Save] in the Set Gauge Properties
window to return to the gauges.
26
3.6
Data Logging
The DashDAQ is not only a powerful gauge
display, it can also log and save all information
represented on the gauges. This information is
saved to a Microsoft Excel *.csv file to an inserted
SD memory card. This allows you to view and
graph saved vehicle parameters any way they like.
To begin logging:
1. Find a particular gauge layout from which
you would like to capture information. Set all
gauges with the signals you would like to
log.
Note: If you pick a gauge layout with seven gauges,
you can log up to seven parameters/signals to the
log file.
2. Tap on [Start Log]. The signals you were
monitoring will be saved to the SD card with
a timestamp. You can continue to monitor
Summary of Contents for DashDAQ Series II
Page 31: ...61...


