


8
Dehaco B.V. • Kruisbaak 25 • 2165 AJ Lisserbroek (NL) •
✆
+31 (0)88 - 20 20 600 •
[email protected] • www.dehaco.nl
4. Monitoring
4. MONITORING
Under monitoring it is possible to see real-time data
on the VAC negative pressure monitors. On the right
of your screen the VACs are sorted under “Groups &
Locations”.
4.1 Groups & Locations
The first sorting is by group so when there is a main
group with a number of subgroups in your account this
is divided up.
In the groups there is sorting by location that is
entered in the VAC negative pressure monitor. When
a VAC negative pressure monitor is switched off, these
go under the group “unused”. When you click on a
group or location, you see all VAC negative pressure
monitors in that group or location.
All VAC negative pressure monitors can be seen
in the form of a “tile”. Here you can see important
information at a glance such as: Location/project,
serial number, name of the VAC, measured real-time
pressure, printer status, modem status, battery status
and system status.
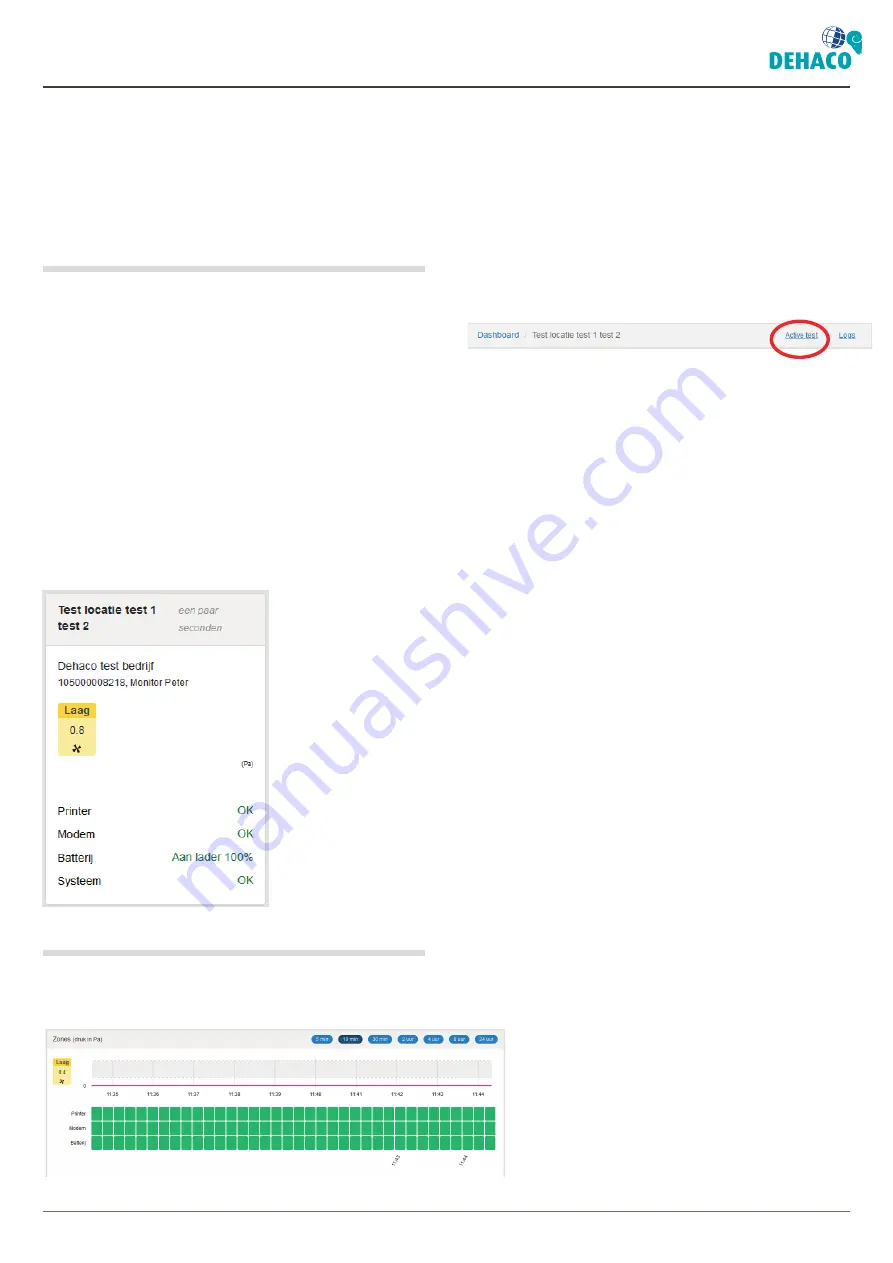
4.2 Real time data per VAC
More data is available if you click on a VAC negative
pressure monitor tile.
Besides the information as mentioned in Section 4.1 a
chart is also shown. This chart can be set to 5 min, 10
min, 30 min, 2 hours, 4 hours, 8 hours and 24 hours.
Under the chart the status of the printer, modem and
battery can be seen in 10-second sections.
Next to the chart the yellow section shows the active
measurement data in the form of a number.
The active test/log can be seen at the top of the page.
This active log can also be seen in the Logs menu with
the tag “working”. This page shows a summary of all
data in a table with a processable chart.
Summary of Contents for VAC CLOUD
Page 1: ...1 VAC CLOUD_2021 08_v1 0_EN User Manual VAC CLOUD ...
Page 2: ......


