background image


www.defiant

-

tech.com


Working with Ellvin/Instrument Files    


Files


The instrument


stores a data file for every sample analysis on an internal SD card. If analyses are performed while the instrument is 

connected to Ellvin, the files are also stored on the user’s computer.


Files stored on the SD card are labeled with a LOG# that the instrument automatically assigns to each run. 

The LOG# is displayed on the instrument screen at the 

start 

of each run. The user should record the LOG# 

and other relevant sample information for future reference.


Files saved by Ellvin on the user’s computer are in XML format and are labeled with the LOG# and the time 

they were created by Ellvin. A separate data file is created for each analysis. The user should record the time, date and 

other relevant sample information.  The Ellvin notes window may be used for this purpose.


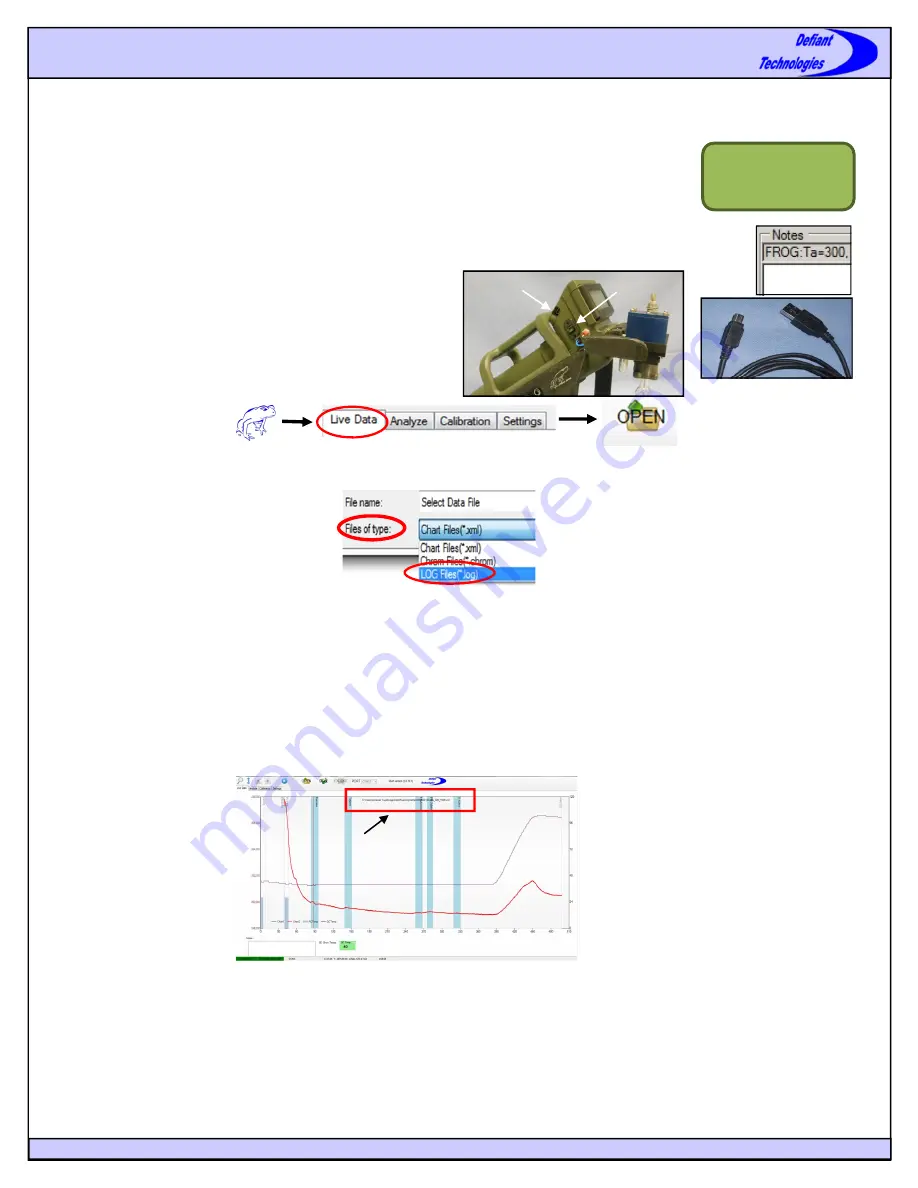
Importing LOG files from the instrument into Ellvin


Method A, Best Practice:


1.


Connect Port N on the instrument


to a computer using the USB

-

Cable (supplied). Turn the instrument on. 


2.


The computer screen will display an option to “Open folder and 

view files”. Open the folder and the screen displays a list of 

sequential files named “LOG_XXX”. 


3.


Select the LOG file of interest and drag/copy it to the computer.


4.


Open Ellvin.


5.


Open Live Data Window


6.


Click the Open Button.


7.


Browse to the location where the LOG file of interest was dragged/copied.


8.


At the bottom of the “Select Data File” window, change “Files of Type” to LOG Files.


9.


Select the LOG file of interest and open it.


10.


The computer now displays a chromatogram of the file data as it is imported into Ellvin. At this time, Ellvin also converts the data to 

an XML format, labels it with the 

time 

it was 

converted 

(not the time it was recorded on the instrument) and stores it.   Ellvin stores the 

XML file in a folder labeled with the 

date 

that the data was converted. The location path of the stored data is displayed at the top of the 

chromatogram in the Live Data Window.


Method B:


1.


Connect Port N on the 

instrument


to a computer using the USB

-

Cable. 

Turn the instrument on. 


2.


Open Ellvin, open Live 

Data Window, click on the Open Button.


3.


Select the instrument from 

the “Look In” drop

-

down menu at the top of 

Live Data Window.


4.


Change “Files of Type” to LOG Files.


5.


Select the LOG file of interest and open it.


USB Cable to N


ON


N


VOC ANALYZER 


GC TEMP: 40C  

READY


LOG_016


BTEX V. 965 2012


Data Location Path


Summary of Contents for FROG-4000

Page 1: ...wer 4 Turn the instrument power switch to the ON position fully up The instrument display screen will be visible 4 Open Ellvin by double clicking on the Ellvin icon 5 Ellvin opens in the default Live...

Page 2: ...position Running a Sample 1 Instrument screen reads READY 2 Record Log and other relevant sample data for future reference 3 Press the start button in Ellvin or on the instrument to begin an analysis...

Page 3: ...files Open the folder and the screen displays a list of sequential files named LOG_XXX 3 Select the LOG file of interest and drag copy it to the computer 4 Open Ellvin 5 Open Live Data Window 6 Click...

Page 4: ...Look In to select the FOLDER labeled with the DATE that Ellvin created converted the file of interest 4 Click on the file of interest and a preview chromatogram appears on the right side of the scree...

Page 5: ...t is CONNECTED and whether or not parameters have been updated GC Column Temperature Indicator Displays the GC temperature The icon is GREEN when instrument is ready for loading The icon is RED when t...

Page 6: ...of the features in Live Data Window the following features are available in Analyze Window Integrator 1 The user creates a baseline and integrates peaks then calculates the peak height and area to det...

Page 7: ...he analyte in the Analyte Alias window maximum of 5 Characters 3 Click the ADD button Correlation Chart and Equations This feature in the Calibration Window displays the degree of correlation between...

Page 8: ...s Tb Ramp time from GC cold to GC hot temperature seconds Tc Hold time at hot GC temperature seconds Ct Initial cold GC temperature o C Ht Final hot GC temperature o C CLEAN Time cleaning PC by heatin...

Page 9: ...air sampler by connecting to this port Figure 5 Connect exhaust connector to exhaust port ANALYZE Position Figure 3 Sample Introduction Valve Coupler Line Transfer Line Sparge Needle Port Valve Contr...

Page 10: ...ampler can now be connected to a Tedlar bag to calibrate the instrument or to the wand to collect air samples 5 Press the yellow start button on the instrument or in Ellvin to begin an air sample anal...

Page 11: ...position is facing toward you 5 Turn valve position counterclockwise to the right place sparge bottle in up position on Frog 4000 and tighten the nut around sparge bottle 6 Run Frog 4000 as normal by...

Page 12: ...d high drain rate battery packs Neither Defiant Technologies nor Tenergy Corporation are responsible for damage caused by charging other battery pack brands with this charger Use 1 8A current for batt...

Page 13: ...Sparge Bottle 3 Frog With Sparge Tube Protector 4 Serial Data Cable 5 USB Cable to N 6 Battery 7 Air Sampler a Transfer Line b Air Sample Couple Line c 1 16 3 16 Adapter 8 Power Cable 9 Battery Charg...

Page 14: ...rge Bottle 3 Frog With Sparge Tube Protector 4 Serial Data Cable 5 USB Cable to N 6 Battery 7 Air Sampler a Transfer Line b Air Sample Couple Line c 1 16 3 16 Adapter d Air Sample Wand 8 Power Cable 9...

Reviews: