


EASY
SENSE Vu+ Reference Manual DO255 (3)
8
Data Harvest Group Ltd.
Use the up and down buttons
▲▼
to view data from the sensors.
Use the enter button
►
to check or change the sensors range or to switch a sensor off (see
).
The stop button
will
temporarily halt the updates to the sensors readings. Two lines ▌▌ (top left)
indicate that the display is paused.
Press enter
►
to cancel pause and continue in Meters.
Press stop
again to exit Meters and return to the main menu.
Pictogram
Pictogram
uses an image, block or bar to represent the data. Each represents a 10
th
of a total range
(or span) of the sensor and displays a number from zero to ten (proportional to the reading). Sensor
readings are captured every time the enter button
►
is pressed, rather than at regular time intervals.
The samples are stored to Vu+
’s memory - a maximum of ten samples per data set.
Connect any plug-in sensors. If the display is turned off, press any button to wake up Vu+
.
While in the main menu use the up or down buttons
▲▼
to scroll until the cursor is pointing at
Pictogram
. Press the enter button
►
to select.
Use the
▲▼
buttons to move the cursor until it points at how you want the data to be
represented. Press enter
►
to select.
Each time you press the enter button
►
Vu+ will take a reading from the sensors (built-in and
any plug-in) and will show the number of samples taken so far.
Use the up or down buttons
▲▼
to scroll and view data from the sensors.
Note:
If Vu+
goes into ‘sleep’ mode during logging, press any button to wake up the logger and then
►
to
take a reading
.
When you have finished sampling press the stop button
to close the data set, then
►
to
confirm your choice.
The readings will be stored as a data set with a maximum of ten samples per set. A data set is
identifiable by the method and time and date the recording was started i.e. Pictogram 09/05/16 16:12:43.
The contents of the data set can be:
Reviewed on Vu+ - select
Review
from the main menu, use the
▲▼
buttons to locate the data
set and press enter
►
to select. Use the
▲▼
buttons to scroll through individual readings.
Downloaded to a computer by selecting
Retrieve Remote
from the Home
screen in the EasySense software (see
).
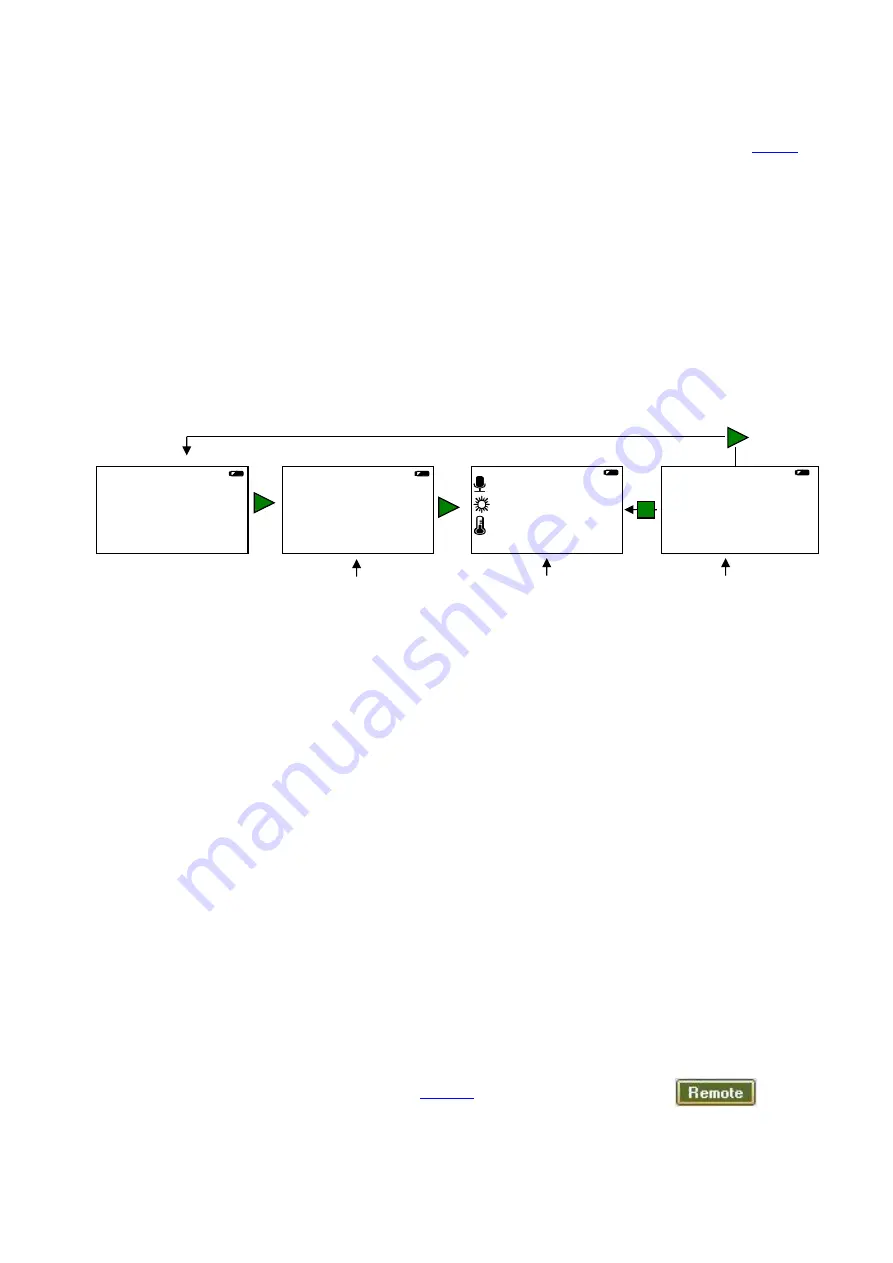
Press either enter to confirm your
choice or stop to continue logging
▼
Meter
►Pictogram
EasyLog
▲
▼
Icon
►Block
Bar
▲
3 ▌▌▌
5 ▌▌▌▌▌
4 ▌▌▌▌
Samples taken 2
Stop Recording?
► to stop
█ to go back
Select whether data should be
represented by an icon
(picture), a block or a bar
Press stop when
you’ve taken
enough samples
Press the enter button
to collect a sample
(maximum of 10)


