ENGLISH
19
13.5 Graphs
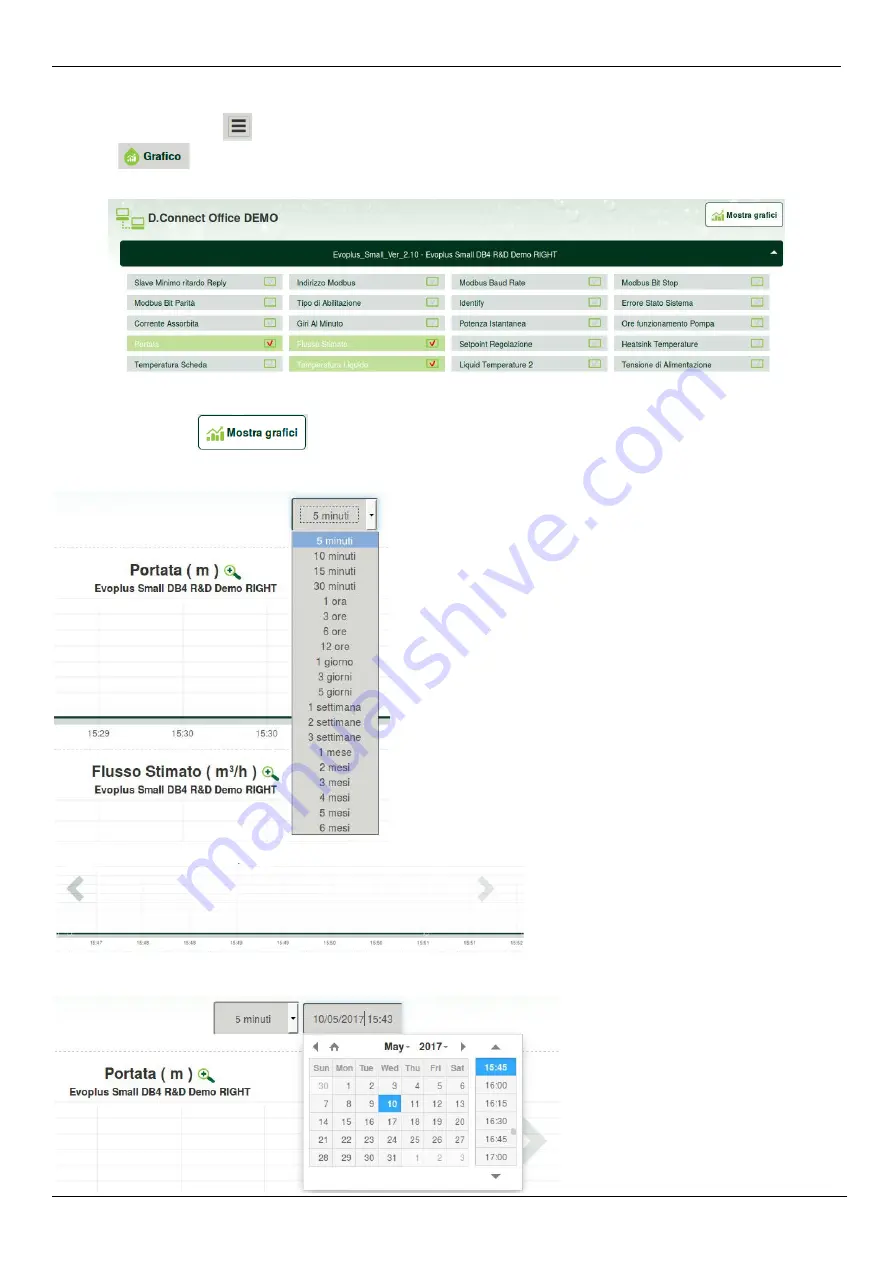
It is possible to view the behaviour of the parameters of each product previously added to an installation:
1. Click on the Options menu:
2. Click on:
3. For each Component of the installation, select the parameters that you want to view:
Figure 14: WebAPP – Graphs
4. Click on Show Graphs.
The updated graphs of the desired parameters will appear. You can change the time scale by clicking on the drop-down time menu and
choosing the most suitable value.
By clicking on the arrows on the right or left of the graph, it is possible to move to the time before or after the point selected.
In this way it is also possible to indicate the exact time at which you want to analyse the behaviour of the component.
Click on the date/time field and select from the menu the day and the desired time range.
Figure 15: WebAPP - choice of the time window for graphs
Figure 16: WebAPP - Time Window for graphs
Figure 17: WebAPP - Choice of date and time
for graph display


