18
Sensor Maps
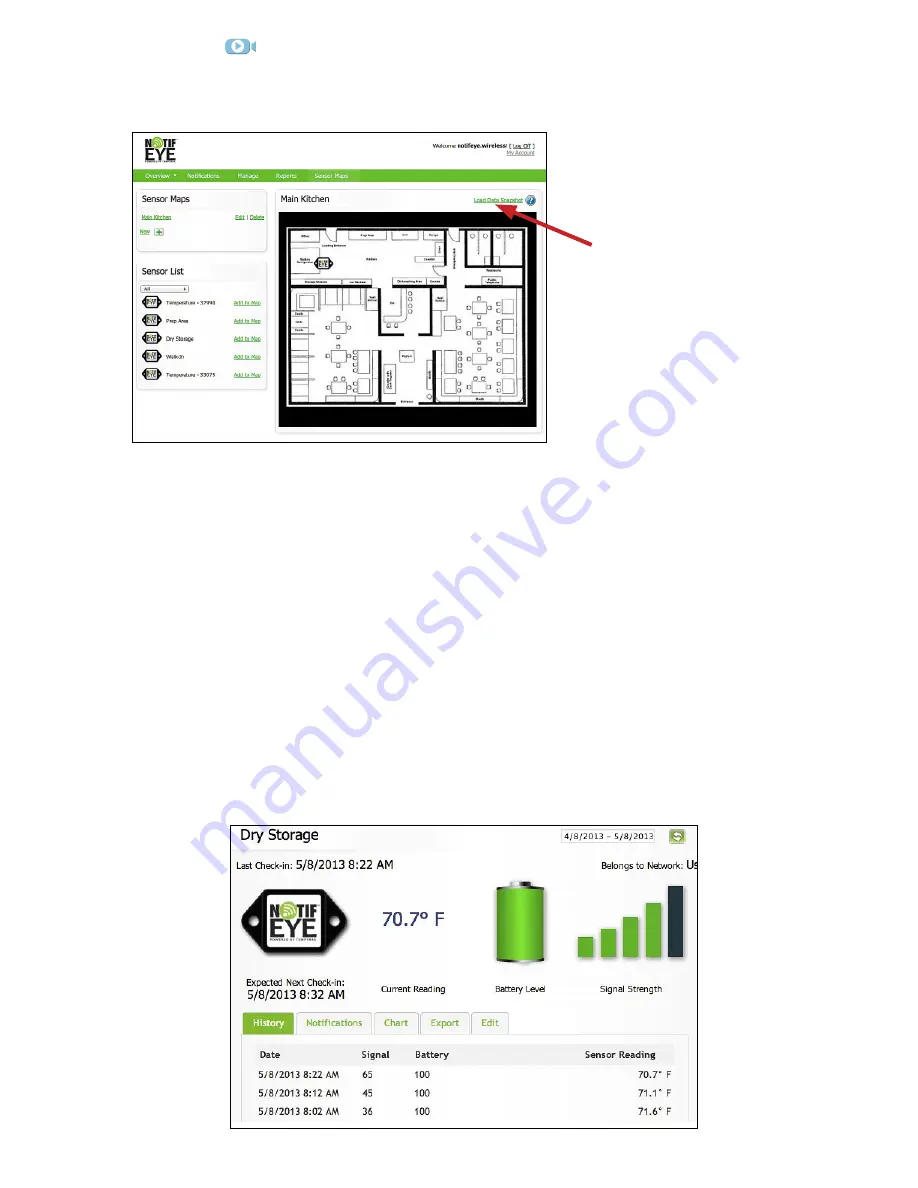
The first time the Sensor Map tab is selected you will be prompted to choose and upload an image of
your facility from your own files. Your sensors can be superimposed onto this image to represent their
physical location in the facility.
Clicking and dragging with the mouse allows you to view different portions of the map. To place a
sensor on the map, under the Sensor List, click the “Add to Map” link next to the chosen sensor, or
click and drag the sensor image to its desired location. Mousing over any sensors that are on the
map will display the last reading while clicking a sensor will display the sensor information window.
To zoom in and out of the map, click on the “+” and “-” buttons in the bottom right of the image map.
Remove a sensor by right-clicking on the sensor and select “Remove From map”. To add additional
maps, in the Sensor maps pane, click “New” link.
Note:
All your available sensors will be listed in the left, Sensor List pane. To only view sensors in a particular
network, select the network from the dropdown box.
Sensor History and Chart Views
Select the “Overview” tab in the main navigation bar. Click on a sensor name from the list in the left
pane to bring up the sensor navigation tabs. Clicking on the “History” or “Chart” tabs within the sensor
data window allows you to view the sensor data history as text or in a graphical chart for the date
range specified in the top right corner. To change the date range of the viewable information, click on
the date range box at the top right of the sensor data window.
Note:
If you view data immediately after setting up your system, the chart will not have enough readings to create a
graph; you must wait until your sensor has checked in multiple times.
Load Data Snapshot gives an
overview of the last readings for
all sensors shown on map.


