EasyScopeIII for DS60M10 User Guide
Version 1.3
Document Reference No.: CP_000037 Clearance No.: CP#027
Copyright © Connective Peripherals Pte Ltd
40
4.3.5
Slide bar
The slide bar allows scrolling through the logged data.
The plot area is updated as the scroll bar is moved. If tracking is enabled, the slide bar is disabled. The
slide bar can be operated by dragging the handle or by clicking on it.
4.3.6
Scale Panel
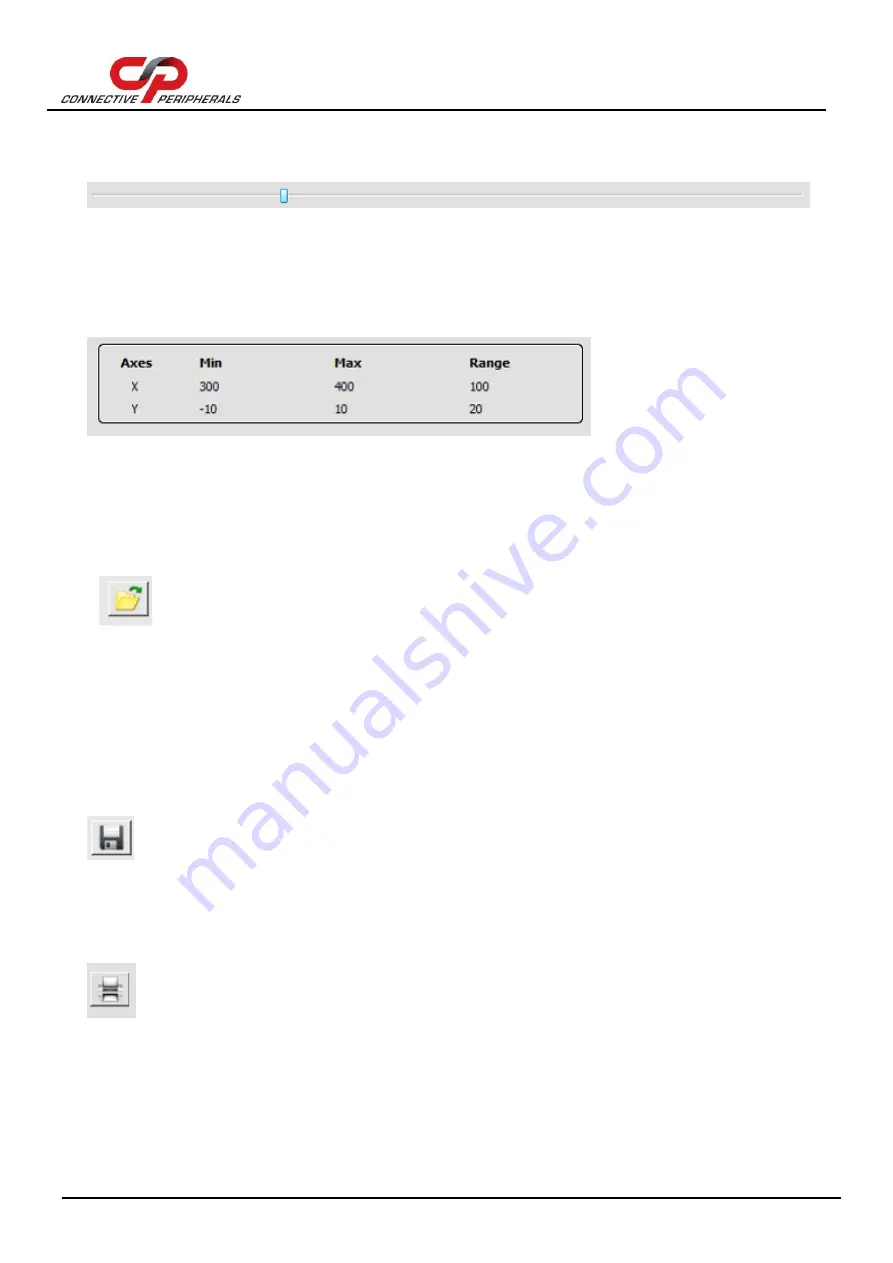
The scale panel indicates the area of the chart currently visible. The default values before logging are
shown below.
The values are updated when scaling values are updated.
4.4
Toolbar Buttons
4.4.1
Open Chart
Clicking the Open Chart button will display an open dialog box.
The user can then browse a CSV file (*.csv) which can be imported back into the data logger for viewing.
If there are memo markers accompanying the sample data, it will also be shown in the chart.
When a file is opened, the sample rate and sample rate unit will be updated based on the value in the
CSV file. Also Clear Screen option is disabled.
4.4.2
Save Chart
Clicking the Save Chart button will display a save dialog box that allows the user to save the current data
chart in CSV format. After saving, the filename will be listed in Window menu.
If there are memo markers in the chart, it will also be saved.
4.4.3
Print Chart Area
Clicking the Print Chart button prints the current plot area of the data logger.
The data printed can be changed by using the slide bar or zoom controls.


