background image

PowerSoft


PowerSoft – Instruction manual 


59 


5.8.3.2


C

ONTRACTUAL POWER OPTIMISATION 


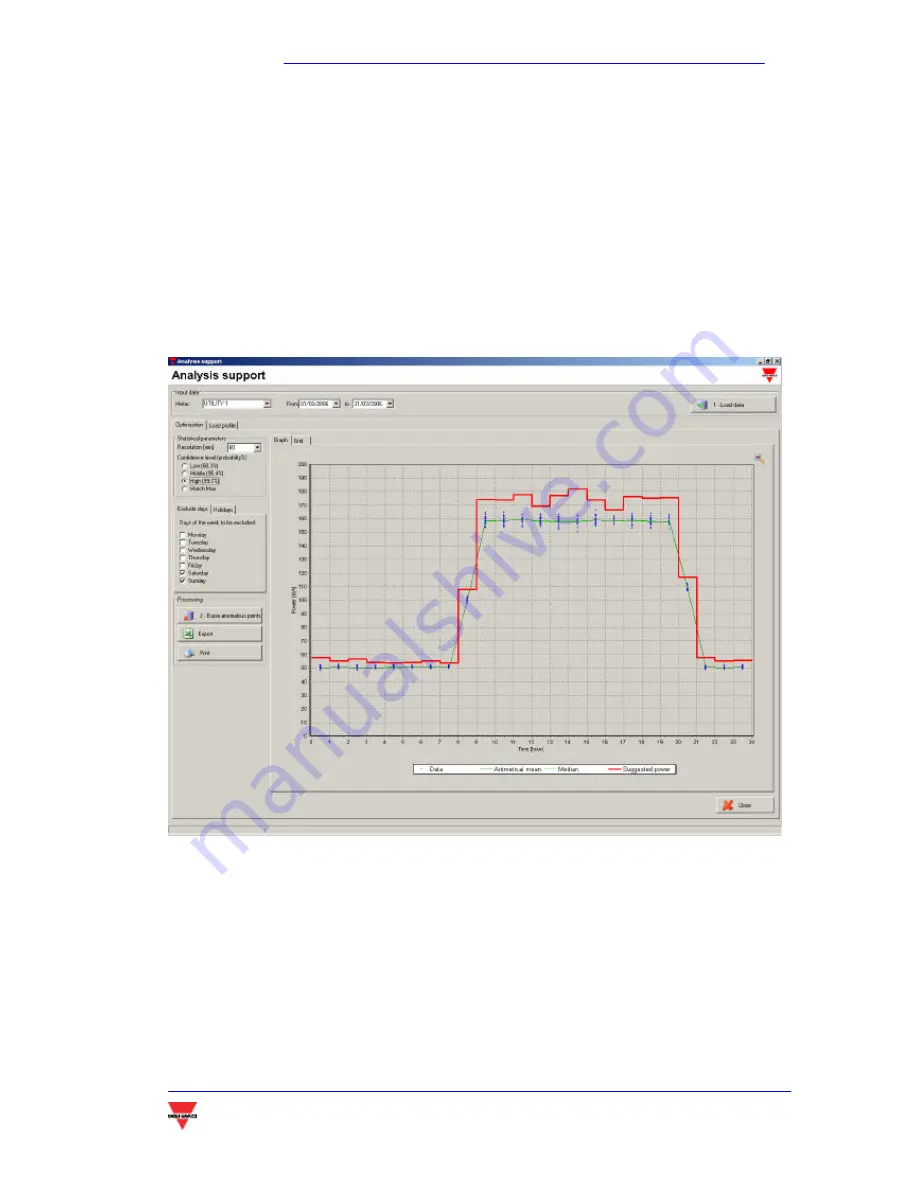
The graph displayed in the section 

Optimisation

 shows the consumptions of 

the selected instrument in the selected period in function of the time of the 
day. Studying the consumptions hour by hour, it is possible to identify the 
average consumptions and the maximum values that can be expected by 
that instrument. The procedure to get this information is automatic, but it 
requires important  user’s interventions in order to carry out a  correct 
analysis.  


After uploading the data, the statistical parameters are to be properly set. 
The 

Resolution 

indicates the duration of the time intervals in which the day is 

split (from 5 to 60 minutes). The 

Confidence level 

indicates the probability that 

the consumptions of the instrument are below the proposed contractual 
power.  

Summary of Contents for POWERSOFT

Page 1: ...POWERSOFT INSTRUCTION MANUAL...

Page 2: ...3 4 3 Inputs Outputs 26 3 4 4 Fresnell 27 4 SOFTWARE SAFETY 29 4 1 SAFETY LEVELS 30 4 2 LOGIN 31 4 3 LOGOUT 31 4 4 EXIT 32 4 5 USER CONFIGURATION 32 4 5 1 Creating a new user 33 4 5 2 Deleting a user...

Page 3: ...PPORT PWS ANALYSIS MODULE 56 5 8 1 Target 56 5 8 2 Graphical structure 57 5 8 3 Operations 57 5 9 THE WEB SERVER PWS WEB MODUILE 63 5 9 1 The toolbar and the modules 64 5 9 2 Exporting a table on Exce...

Page 4: ...PowerSoft PowerSoft Instruction manual 4 INTRODUCTION...

Page 5: ...cost reduction point of view it is important to monitor the energy consumptions to control the demanded power peaks and to exploit accurate data processing and analysis tools PowerSoft is a sophistic...

Page 6: ...optional modules that allows adding different features to satisfy different requirements or to solve specific applications The software can automatically adapt itself according to the electrical syst...

Page 7: ...and animated synoptic pages that allow o to display the plant configuration o to display the real time data o to monitor the digital input status acquired by the instruments on the field commands the...

Page 8: ...ment etc and of the alarms set point alarm communication errors missing data storage etc and to carry out filter based searches Set point configuration optional module PWS Alarm the set point alarms c...

Page 9: ...xternal events Costs estimation optional module PWS Bill according to the utility contract parameters the module allows to estimate the costs relevant to a selected month due to the energy water and g...

Page 10: ...PowerSoft PowerSoft Instruction manual 10 2 INSTALLING POWERSOFT...

Page 11: ...oft Instruction manual 11 2 1 SYSTEM REQUIREMENTS PowerSoft needs of the following minimum requirements Processor Pentium II 400 RAM 256 Mb Hard disk 100 Mb free Monitor 1024x768 Windows 98 NT 4 2000...

Page 12: ...PowerSoft After a successful installation a new entry on the Start Program menu is available it includes the link to PowerSoft the Configurator and to the relevant uninstalling program After the insta...

Page 13: ...unicating him the access key provided by the software itself in the above example see the picture it is HPKIFDCN Editing the returned access code paying attention to the capital letters the software a...

Page 14: ...level see below but for safety reasons it is suggested to create at least a new Administrator user or more of them and the required simple Users and then delete both the default users The User can acc...

Page 15: ...PowerSoft PowerSoft Instruction manual 15 3 OPERATING POWERSOFT...

Page 16: ...ft the variable recording on the database is interrupted 3 1 2 THE EDIT MENU It includes the Language submenu that allows changing the language of the menus windows and messages of PowerSoft Only a lo...

Page 17: ...displayed The instrument is grouped according to the relevant communication line For the details on the real time window see paragraph 1 11 The All the meters entry allows to show all the measurements...

Page 18: ...each one of them includes five instruments using the arrows in thetop left box or the relevantdrop down menu it is possible to scroll the different pages In the same box there is the indication of the...

Page 19: ...ge drop down menu where the relevant page is highlighted in red too 3 1 5 2 THE ACTIVE ALARMS SECTION Clicking in this section opens the Active alarm window Each alarm is grouped according to its Type...

Page 20: ...op right buttons it is possible to acknowledge the selected alarm or all the alarms at the same time Only a logged in user can acknowledge an alarm Filtering using the two top left buttons it is possi...

Page 21: ...des the Add ons and New key entries Add ons it supplies the information about the version of the software and of all the modules The shown page is the one which appears during the start up of the soft...

Page 22: ...n the system 3 The presence of active or non acknowledged alarms if the following icon is yellow If any alarm is active or non acknowledged the icon is grey Double clicking on the icon the active alar...

Page 23: ...trument picture or to browse among the other pages using the proper link buttons Any alarm status of each instrument is directly availableon the synoptic pages if the instrument is not communicating a...

Page 24: ...dicates that a new reading has been preformed from this meter and that the displayed values have been updated The buttons functions on the bottom are respectively to enter the analytical trends window...

Page 25: ...not possible to change the displayed variables In the above picture the red arrows show the setpoint values assigned to the variables system active power and current phase 1 in the example Two setpoi...

Page 26: ...ulated from the last recording variable data log on the hard disk and the time of the last recording If one of the variables exceeds the relevant setpoint the background of the same variable is red Th...

Page 27: ...request The digital output status can be changed only by a user logged in as Administrator Once the command has been sent the new status can be displayed only when the system polls the relevant instr...

Page 28: ...PowerSoft PowerSoft Instruction manual 28...

Page 29: ...PowerSoft PowerSoft Instruction manual 29 4 SOFTWARE SAFETY...

Page 30: ...to the allowed access level The three access levels are listed below Administrator level it allows a full control of the software system New users administrator or user levels can be created and the s...

Page 31: ...d Both user name and password can be indiscriminately written in capital or small letters To confirm the edited data the Login button is to be pressed Now the Login entry of the Login menu is replaced...

Page 32: ...f an appropriate message if the session is to be extended or not 4 4 EXIT PowerSoft even after a log out continues to poll the meters store the desired values on the database control the variable set...

Page 33: ...et the above window Edit Name Password and confirm the password Choose the access level for the new user Click on the Add button The new user and its access level are added in the list on the left 4 5...

Page 34: ...PowerSoft PowerSoft Instruction manual 34 Click on the Delete button and choose Yes when the system asks for the confirmation Pay attention because this operation cannot be undone...

Page 35: ...PowerSoft PowerSoft Instruction manual 35 5 ADDITIONAL MODULES...

Page 36: ...les which are integrated in the main core of the software No module is needed to PowerSoft but each module simply adds some features Some modules are included in the base package some others are optio...

Page 37: ...e columns together with the relevant instrument All the reports can be printed and exported in xls format Excel version 4 and following and in csv comma separated values format 5 2 1 CREATING A REPORT...

Page 38: ...s the previously displayed values Once the variables are configured the period of time to be analysed is to be set On the left the starting and ending time and dates can be set Clicking on the Modify...

Page 39: ...PowerSoft PowerSoft Instruction manual 39 NOTE other predefined trends can be added to the system Please contact the supplier for the relevant instructions...

Page 40: ...be shown at the same time 5 3 1 ANALYSING A GRAPH The information relevant to the programmed trends is displayed on the legend on the left side each part of the legend is relevant to the trend The fol...

Page 41: ...ool bar The tool bar includes The date of the displayed data The displayed time interval If 1 is selected the time interval is 1 day 7 means one week and 31 one month The displayed week or month are t...

Page 42: ...as a line or asa histogram according to the selection in the graph type box The Show button changes the variable on the graph while Cancel leaves the previously displayed trend Once the variables are...

Page 43: ...r modify the displayed date or period NOTE other predefined trends can be added to the system Please contact the supplier for the relevant instructions 5 3 4 OTHER TOOLS Other tools such as the zoom t...

Page 44: ...background of the graph area the different colours associated to the tariffs In this way it is possible to correlate in an easy and immediate way the trend of the consumptionsand their costs The cont...

Page 45: ...PowerSoft PowerSoft Instruction manual 45 The graphs can be exported in wmf format windows media format that is a vectorial format in 24 bit bmp format...

Page 46: ...e selected instrument are listed in the central box Two indicators are shown close to each variable The SW indicator shows if any software alarm connected to that variable is enabled green disabled bu...

Page 47: ...atically helpsthe user to set the right values If the same setpoint on the same variables are to be set in different instruments a copy paste function is available When the setting is done in one inst...

Page 48: ...value acquired at 11 00 from the instrument named 01_TCP1 is 185kW The system checks if the Enable contractual setpoint alarm SW box is enabled in this case the contractual power of the tariff releva...

Page 49: ...ble A a table including the tariff associated to each hour of the day table B a table where a different contractualpower and identification colour can be associated to each tariff table C 5 5 1 THE TA...

Page 50: ...ANT CONTRACTUAL POWER To modify the colour associated to a tariff double click on the colour box on table C The colour dialogue box appears In the next box the contractual power of that tariff can be...

Page 51: ...GURATION To save a new configuration or the modifications press the Save button on the bottom Pressing Cancel all the modifications are cancelled and the old configuration is displayed For this reason...

Page 52: ...analysing the daily trend of the costs in the selected month too 5 6 1 COST CALCULATION The procedure to calculate the costs is the following 1 Choose Energy Gas or Water by means of the 3 top left bu...

Page 53: ...report can be printed or exported in html format using the buttons on the bottom left 5 6 2 GRAPH OF THE DAILY COSTS This section allows graphically displaying the daily costs of energy or gas or wat...

Page 54: ...of the Save button The Cancel button restores the last parameters The parameters can be different according to the supplier The default parameters of PowerSoft meet the most of the contracts the taxes...

Page 55: ...cept is similar to the one described for the active alarms in addition there are the system events such as software start shut down login output status commands etc written in light blue It is not pos...

Page 56: ...er ones but because of the complexity and of the delicacy of this kind of analysis it is recommended that the module is used by expert users only to grant the precision and the reliability of the resu...

Page 57: ...erformed are suggested in the following paragraphs The first step is to generate the load profile graph of the selected instrument 5 8 3 1 LOAD PROFILE EXTRAPOLATION The instrument and the period to b...

Page 58: ...ese anomalies to get a more homogeneous set of data The available filter is a median filter with selectable steps of 3 5 or 7 data It means that every 3 5 or 7 data sequence of the original trend the...

Page 59: ...sumptions and the maximum values that can be expected by that instrument The procedure to get this information is automatic but it requires important user s interventions in order to carry out a corre...

Page 60: ...us factors are considered other anomalous data can still be present They can be due to different reasons holidays during the working days of the selected period production stops strikes damages or ano...

Page 61: ...ce the wider the distribution of the values around the mean median These parameters are very important in determining the optimal contractual power the suggested powers are in fact defined as the medi...

Page 62: ...e can be deduced in case of scattered blue points and if the median is far from the arithmetical mean The result is that the proposed red line is meaningless with respect to the actual consumptions th...

Page 63: ...From this window it is possible to activate or deactivate the web server function by means of the relevant buttons The log of the events relevant to the web server allows the user to be updated on the...

Page 64: ...accessing the information only one access level is available and it is common both to the Users and to the Administrators The web server opens a pop up window to warn about a new alarm situation as Po...

Page 65: ...stalled modules Clicking any available entry on the toolbar a new Explorer window where the parameters necessary to the execution of the required report are to be entered is opened To get a graphical...

Page 66: ...Instruction manual 66 The required parameters are the same as the local version of PowerSoft but are listed with a different layout After setting the parameters pressing on the Execute button the des...

Page 67: ...ng Save image as 5 9 2 EXPORTING A TABLE ON EXCEL To export on Excel the data included in a table provided by the analytical trend module the below procedure is to be followed Choose Tables on the too...

Page 68: ...PowerSoft PowerSoft Instruction manual 68 Select the values to be exported dragging the relevant area with the left button of the mouse then right click and Copy...

Page 69: ...ext Because of the format of the data when copied from Explorer to create a graph on Excel from the PowerSoft Web server table the belowprocedure is to be followed Select the pasted data Click on the...

Page 70: ...The module windows are composed of two sections the first one displays the log of the events connected to the e mailing the second one includes the form to configure the automatic e mailing To send a...

Page 71: ...mailing is possible selecting this menu It allows programming to whom the mails are to be addressed when and with which attachments A new scheduled e mail task can be added pressing the Add new butto...

Page 72: ...setpoint alarm appears These events can be filtered applying the rule to all some or only one instrument In this case the E mail is not immediately sent but only after a delay of 1 minute so to avoid...

Page 73: ...he selected module In the case of the Alarm and events module Set the previous minutes whose events are to be enclosed Set the desired attachment folder where a copy of the attachment is to be saved I...

Page 74: ...Instruction manual 74 connection If it is not available it tries to create a connection using the predefined connection Then the attachment reports are created and sent using the programmed SMTP serve...

Reviews: