


Actiheart User Manual 5.1.31 (Jun 2022)
62
By left clicking on the screen and dragging left or right, it is possible to scroll
through the recording. The default functionality of the left mouse button can be
changed by clicking on the ‘Paints Marker’ radio button. This will allow areas of
interest to be labelled.
6.3.3
Previewing
Data
It is possible to preview the window and beat to beat zoom data for the recording.
This is done by selecting ‘Preview’ from the drop down menu. This produces a
report which contains a graph of the full analysis period showing Activity and HR,
a zoomed activity and HR graph and the histogram, triangular index and
RMSSD:
6.3.4
Printing
Data
It is possible to print out the window data, the histogram, and the general
statistics of the recording. This is done by selecting print from the drop down
menu at the top of the screen.
6.3.5
Copying
Data
Data can be copied from the software for pasting into an external program of the
user’s choice. The selected data is exported to the clipboard and can then be
pasted from there into, e.g. Microsoft Excel. There are three options:
1.
Copy raw data.
This takes the raw activity, heart rate, and IBI data and
puts it on the clipboard.
2.
Copy Detailed Statistics.
Provides an export with header information
and an epoch-by-epoch, time stamped listing of activity and Heart Rate
data with IBI, SD and RMSSD data.
3.
Copy Marker Summary.
This is to copy areas of interest that may have
been labelled in the beat to beat zoom window.
6.3.6
Exporting
Data
It is possible to export data for further analysis in other programs. There are two
options:
1.
Export time-stamped IBI data
.
This is done by selecting ‘Export’ and
then ‘Time-stamped IBI data’ from the menu.
2.
Export HRV Analysis.
This is done by selecting ‘Export’ and then ‘HRV
Analysis’ from the menu
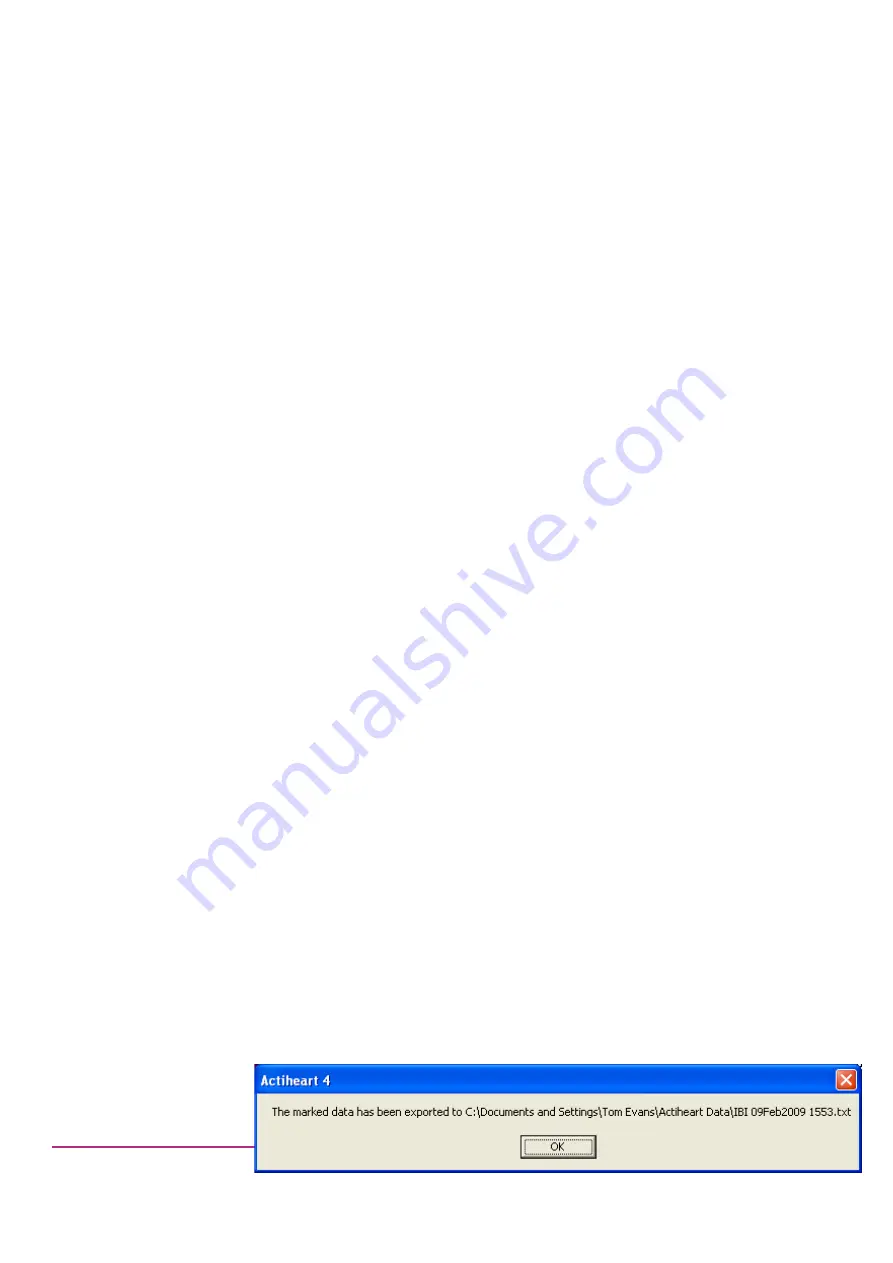
The following message will be produced, showing the file path to which the data
has been exported:


