19
Questions about Cala Trio? Visit CalaTrio.com/HCPFAQs
LBL-5122 Rev C NOV 2019
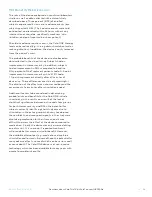
which is defined as the enrolled subjects with a baseline
TETRAS spiral rating ≥ 2, as assessed by the average score
from three independent blinded raters. Due to potential
differences between the in-person spiral rating from
the investigator and the spiral rating averaged across 3
blinded raters, it was possible that a few enrolled subjects
who met the inclusion criteria of a baseline TETRAS spiral
rating ≥ 2 as assessed by the investigator, would not
meet the criteria of a baseline TETRAS spiral rating ≥ 2
as assessed by the average score from the three raters.
In this situation, these subjects were not included in the
Effectiveness Analysis Population (EAP).
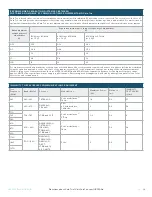
Analysis Populations
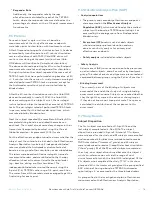
The numbers of subjects in each of the pre-specified
analyses populations are summarized in Table 3 and
described in the subsections below.
TABLE 2
Analysis Populations of Subjects
Total
Treatment
Sham
Enrolled Population
93
48
45
Effectiveness Analysis
Population (EAP)
77
40
37
Per-Protocol (PP)
Analysis Population
6
30
30
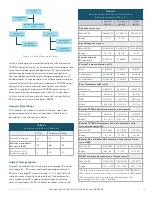
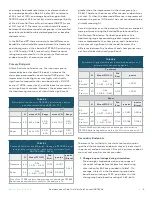
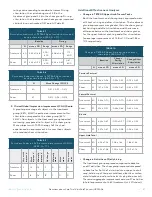
Subject Demographics
Subjects enrolled in the study were on average 70.2 years
old
(range: 35 – 89 years)
and had been diagnosed with
ET for on average 31.4 years
(range: 2 – 77 years)
. 61% of
subjects were currently taking at least 1 medication for
their tremor, and 59% had received at least one prior
form of treatment for ET. Subjects enrolled in the study
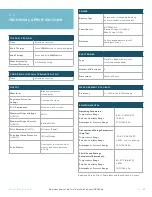
TABLE 3
Baseline characteristics of Effectiveness
Analysis Population (N = 77)
Overall
(N=77)
Treatment
(N=40)
Sham
(N=37)
Age of onset in years
Mean (SD)
38.8 (21.2)
40.2 (21.7)
37.2 (20.7)
Range
5 – 71
5 - 70
5 – 71
Age of diagnosis in years
Mean (SD)
53.4 (14.6)
54.3 (13.9)
52.4 (15.4)
Range
12 – 78
18 - 78
12 – 75
Family history of
ET, yes, n(%)
59 (77%)
32 (80%)
27 (73%)
Current Tremor co-therapy, n(%)
None
28 (36%)
13 (33%)
15 (41%)
1 medication
29 (38%)
15 (38%)
14 (38%)
>1 medication
20 (26%)
12 (30%)
8 (22%)
Prior Treatments of ET, n(%)
Medication
48 (62%)
24 (60%)
24 (65%)
Botox
4 (5.2%)
3 (7.5%)
1 (2.7%)
DBS
0 (0.0%)
0 (0.0%)
0 (0.0%)
Other
3 (3.9%)
2 (5.0%)
1 (2.7%)
Baseline TETRAS Spiral (min score=0, max score=4)
Mean (SD)
2.8 (0.6)
3.0 (0.7)
2.6 (0.5)
Range
2.0 – 4.0
4.0 – 2.0
2.0 – 4.0
Baseline TETRAS Performance Subscale, total score (min
score=0, max score=64)
1
Mean (SD)
26.2 (5.9)
26.7 (5.9)
25.7 (5.9)
Range
16 – 42
17 - 39
16 – 42
Baseline Bain & Findley ADL, total score (min score=25, max
score=100)
2
Mean (SD)
44.9 (9.4)
45.7 (9.0)
44.0 (9.8)
Range
30 – 69
31 - 67
30 – 69
QUEST summary index (min score=0, max score=1)
3
Mean (SD)
0.32 (0.15)
0.30 (0.13)
0.33 (0.17)
Range
0.03 - 0.65
0.11 - 0.63
0.03 - 0.65
1
The total score is the sum of the scores from the 16 TETRAS tasks.
2
The total score is the sum of the scores from the 25 ADL tasks.
3
The summary index is calculated as the average of the
percentage for each of the 5 domains
Screened
(n=111)
Enrolled and Randomized
(n=93)
Screen Failures
(n=18)
Treatment
(n=48; 40 in EAP)
Sham
(n=45; 37 in EAP)
Completed
(n=48; 40 in EAP)
Discontinued
(n=1; 0 in EAP)
Completed
(n=44; 37 in EAP)
Figure 9: Subject Disposition Chart


