9031754 E5
Device View
2-13
Interface Device View
Logical Interface Icon
Multi-Attribute Line Graph Buttons
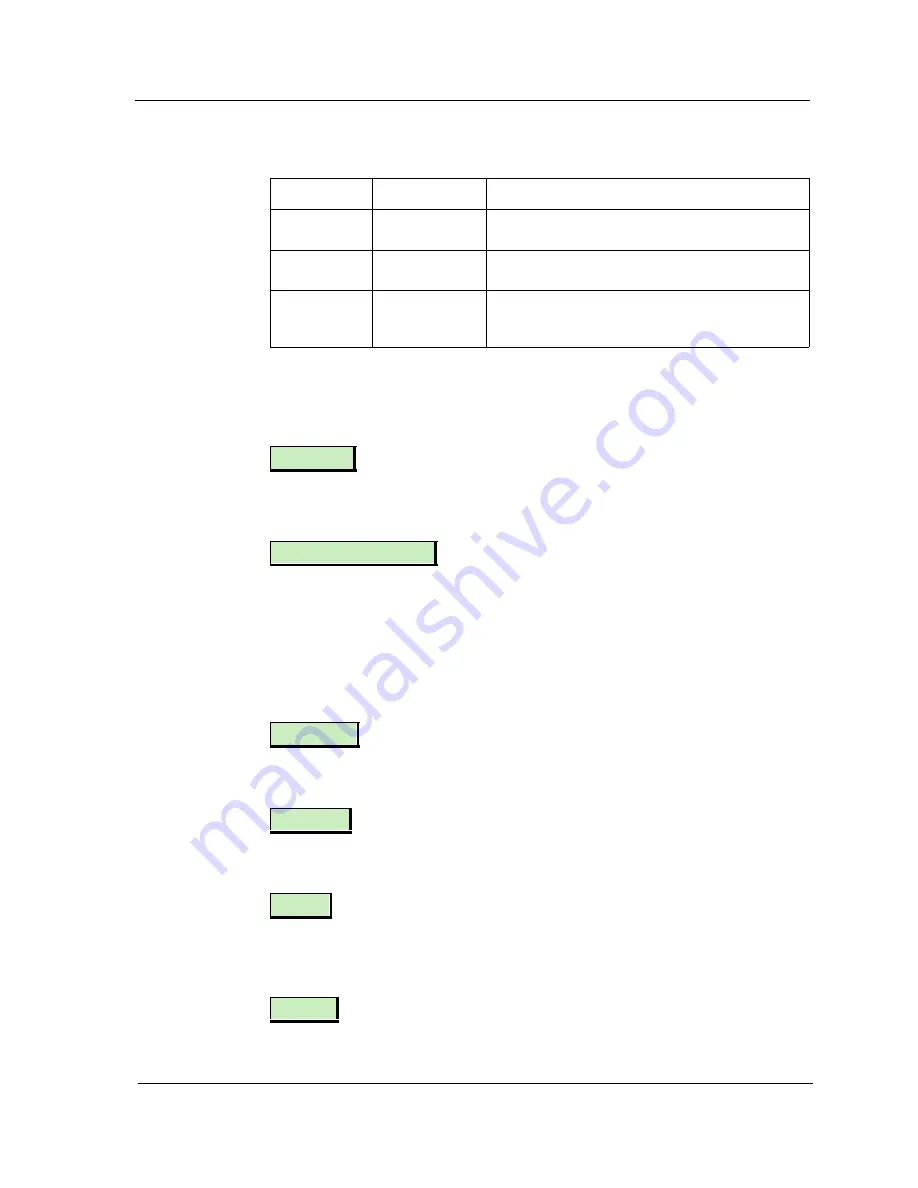
Buttons allow you to modify the statistical presentation of the Multi-Attribute
Line Graph. The following buttons are provided:
This button toggles between a linear or logarithmic scale presentation of the
graph.
This button allows you to set the viewing area of the graph to begin at a
specified date and time. When pressed, this button also displays two other
choices.
Choosing Change Time Scale allows you to set the time scale for the graph
within the range of 1 to 100 hours.
Choosing Data Logging allows you to store the polled data in the database.
Pressing this button brings up a multi-attribute line graph that only displays
information about packets sent through the interface.
Pressing this button brings up a multi-attribute line graph that only displays
information about packets received through the interface.
Pressing this button brings up the Interface Detail view for the highlighted
interface. This view displays information about the Packet, Error, and Discard
rates in three color-coded pie graphs.
In Load
Green
The amount of bandwidth used per packets
received during the port’s uptime.
Out Load
Mustard Green
The amount of bandwidth used per packets
transmitted during the port’s uptime.
Total Load
Light Green
The amount of bandwidth used per packets
received and transmitted during the port’s
uptime.
Table 2-5.
Color and Statistical Definitions for each Attribute (Continued)
Statistic
Color
Description
Lin/Log
Scroll to Date-Time
Transmit
Receive
Detail
Config


