4-4
User’s Guide
Event Message Status
The
New Event Message
icon informs you that new messages have arrived and that you
can click the
View Event Message
icon to view them (the number of unprocessed event
messages is also displayed). See
Consulting Event Messages, the Hardware Faults List,
and History Files
, on page 4-21
The
Event Message Severity
icon indicates the set maximum severity level of
unprocessed event messages. See
Understanding Event Message and History Severity
Levels
, on page 4-20.
PAM Tree Pane
As Customer Administrator, you can view the presence and functional status of each
hardware element from the PAM Tree pane.
Note:
The PAM Tree
pane is refreshed at your request. Use the
Refresh PAM Tree
button to
update the display when required.
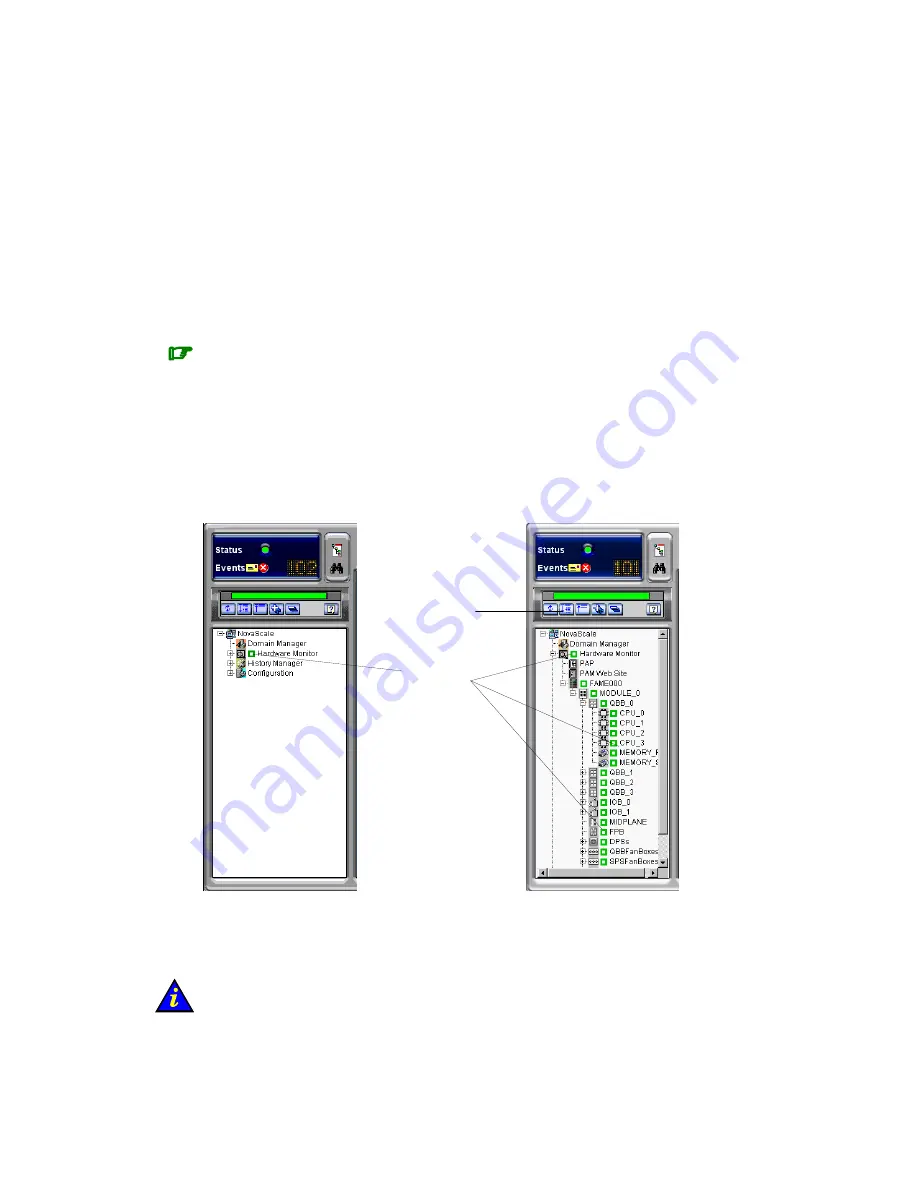
Displaying Presence Status
When, as Customer Administrator, you log onto the PAM Web site, server hardware
presence status is displayed in the PAM Tree by default (square, colored indicator next to
the
Hardware Monitor
node). If you expand the PAM Tree, the presence status of all
hardware elements is displayed.
Expand PAM Tree
button
Presence status
indicators
Figure 34.
PAM Tree hardware presence status display
When hardware presence status is normal, all presence status indicators are green.
Table 13. explains possible hardware presence status indications.
Important:
If a PAM Tree hardware presence status indicator is not green, this could be normal if
a hardware element has been removed for maintenance. See
What to Do if an Incident
Occurs
, on page 4-25.
Summary of Contents for NovaScale 5000 Series
Page 1: ...Bull NovaScale 5000 Series User s Guide 86 A1 89EF 02 ORDER REFERENCE...
Page 2: ......
Page 20: ...xviii User s Guide...
Page 24: ...xxii User s Guide...
Page 56: ...2 14 User s Guide...
Page 98: ...4 30 User s Guide...
Page 150: ...5 52 User s Guide...
Page 176: ...User s Guide B 24...
Page 228: ...G 10 User s Guide...
Page 234: ...X 6 User s Guide...
Page 237: ......
Page 240: ......


