User Manual | Mitchell Diagnostics | Scan Tool | 34 | en
©Mitchell International, Inc.
581624 | REV. B | 06.2017 | APDMD032018
Data Stream View Button Definitions
Reduce View Function
To Zoom Out, press the Reduce View
button.
Enlarge View Function
To view the data in the enlarge view,
press the Enlarge View button.
Zoom Out Function
To Zoom Out, press the Zoom Out button.
Zoom In Function
To view the data in the Full Screen Mode,
press the Zoom In button.
Full Screen View Function
To view the data full screen, press Full Screen button.
Menu
Capture
Playback
Sort
Custom
Expand
Data Stream All Data Items
2003 Cadillac CTS Luxury Sport 3.2L ENGINE
1 of 10
200 / 200 frames
BUFFERING DATA..
A
Z
Shrink
5
Calculated Converter Temperature
2145
1643
°F
-56
286
259
°F
-49
Startup Engine Coolant Temperature
ss02764
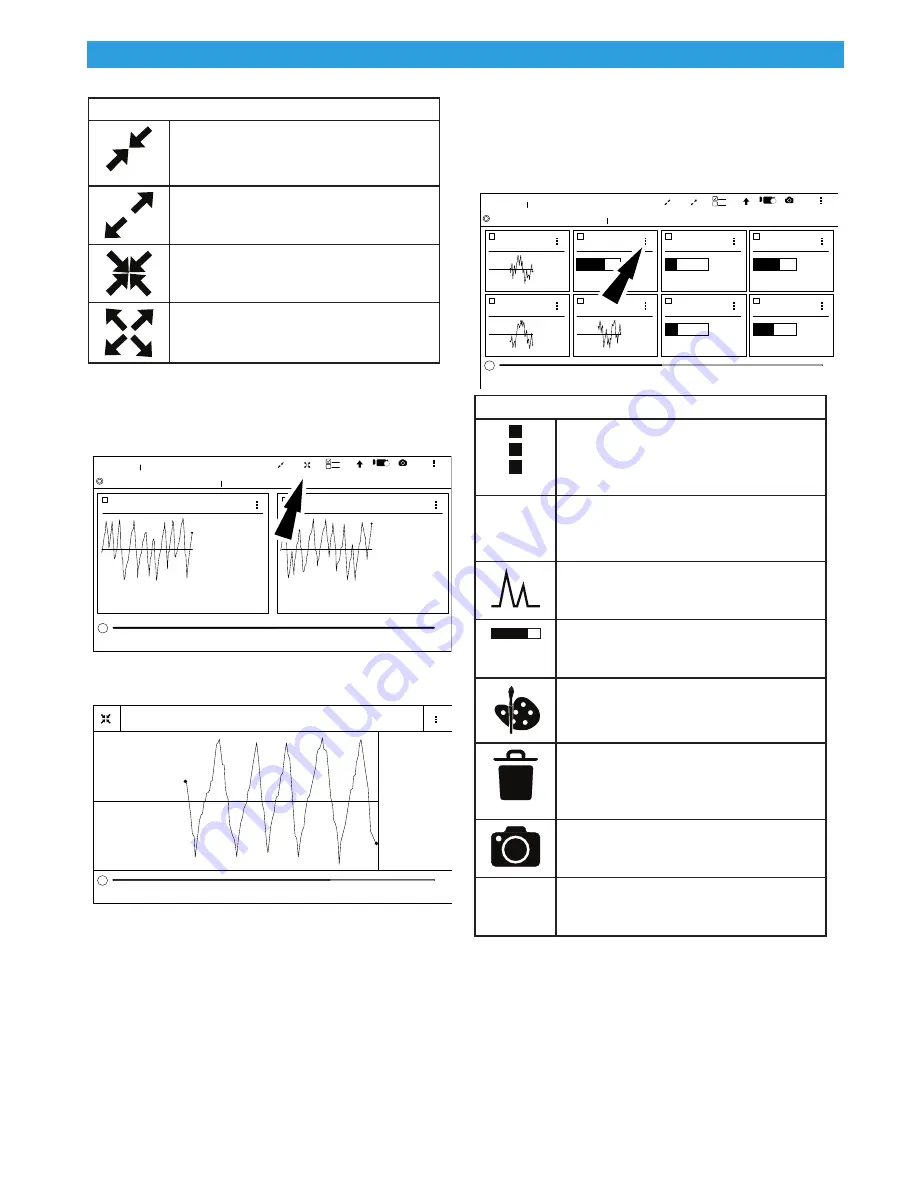
Note: The left graph will be shown full size.
Calculated Converter Temperature
2224
-31
347
°F
1 of 20
135 / 200 frames
BUFFERING DATA..
ss02765
To see more graphs use your finger to swipe the
screen.
Note: Depending on your Scroll Options preference either horizon-
tally or vertically.
Display Types
To change data item display types, select the data
item menu button located in upper right.
Menu
Capture
Playback
Sort
Custom
Expand
Data Stream All Data Items
2003 Cadillac CTS Luxury Sport 3.2L ENGINE
1 of 3
100 / 200 frames
BUFFERING DATA..
A
Z
Shrink
5
Heated Oxygen
Sensor Heater
Bank 1 Sensor 1
Del Torque PWM
Duty
Heated Oxygen
Sensor Heater
Bank 1 Sensor 2
Generator F-
Terminal Signal
14.19
1.19
9.31
Avg
Low
High
21.14
gal
Fuel Level
Fuel Tank Pressure
986
°F
72
2178
-4
°F
-49
289
Calculated
Converter
Temperature
-0.5
inH2O
-12.6
11.2
30
2
46
Avg
Low
High
98
%
64.2
7.8
48.2
Avg
Low
High
95.8
%
34
5
47
Avg
Low
High
94
%
52.7
9.5
53.6
Avg
Low
High
98.4
%
Startup Engine
Coolant
Temperature
ss02766
Display Type Button Definitions
Menu Button
Tapping the Menu button displays a
pop-up link that takes the user to more
buttons.
##
Digital
To change to digital form, select the ##
Digital button.
Line Graph
To change to line graph, select the Line
Graph button.
Bar Graph
To change to bar graph, select the Bar
Graph button.
Change Color
To change the color of a graph, select the
Change Color button.
Clear All Data
Select Clear Data to clear displayed data
stream. This function will reset the timeline
frame counter and clear graphed data.
Take Screen Capture
Selecting Take Screen Capture will save a
copy of the current open screen.
Use Metric Units
Selecting Metric Units will switch from
English/Standard Units to Metric Units.


