


724-746-5500 | blackbox.com
Page 74
724-746-5500 | blackbox.com
Chapter 7: Using SmartPath EMS VMA
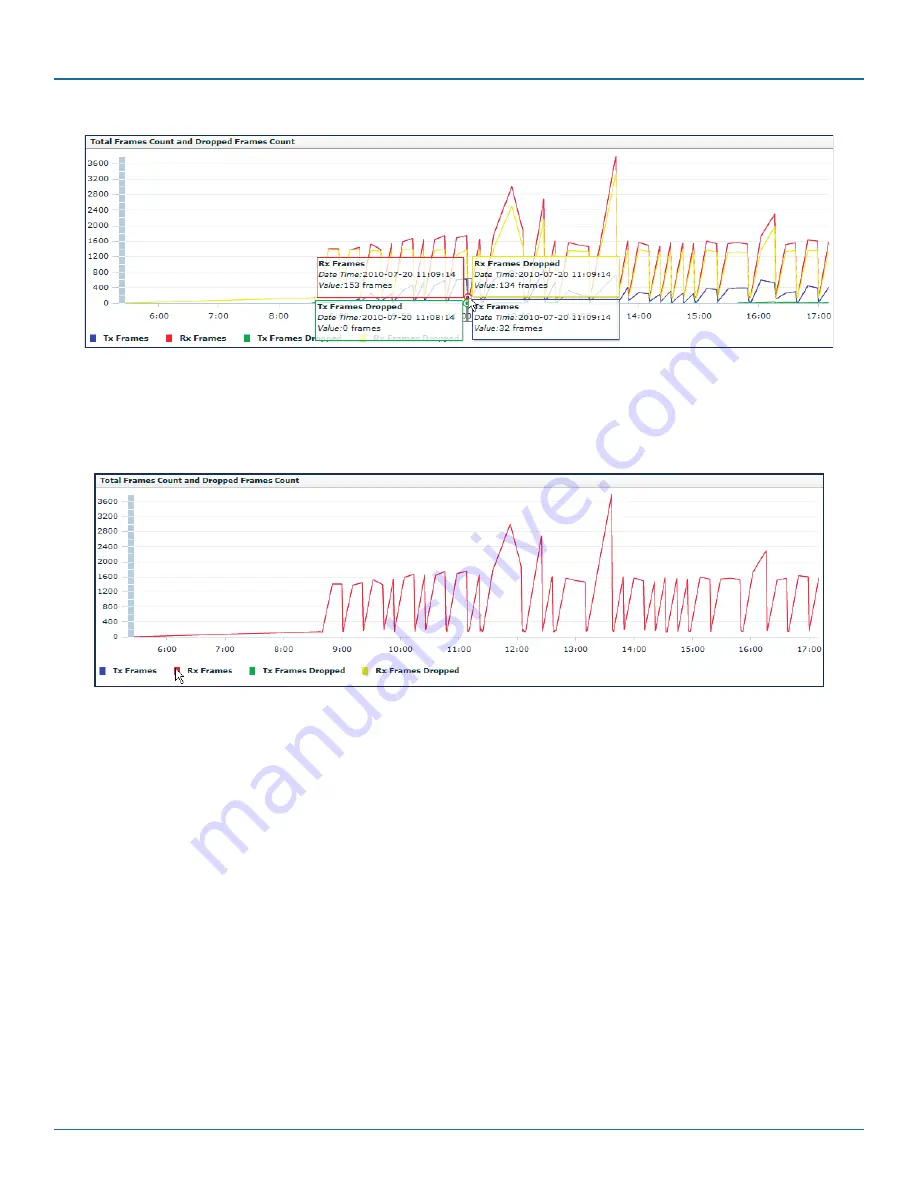
Figure 7-10. Working with graphs in reports.
Moving the mouse over a measurement point in a graph displays data about that measurement. If measurement points on multi-
ple lines happen to converge at the same point, SmartPath EMS VMA displays data for all of them. Here you can see information
about the total number of transmitted (Tx) and received (Rx) frames and dropped frames.
Figure 7-11. Working with graphs in reports.
In the graph showing details for a selected active client, moving the mouse over a colored box in the legend hides all other lines
except the one that is the same color as the box under the mouse. Here SmartPath EMS VMA only shows the red line for
transmitted frames because the mouse is over the red box next to Rx Frames in the legend.
7.2.2 CAPWAP Latency Reports
CAPWAP Latency Reports:
SmartPath EMS VMA tracks the average latency in its CAPWAP connections to each managed
SmartPath AP and displays an icon indicating the average amount of current latency in the Connection column on the Monitor >
Access Points > SmartPath APs page when viewed in Monitor mode. A green hexagon indicates normal latency, based on an
average that SmartPath EMS VMA has calculated from periodic SmartPath AP reports. The icon changes to yellow when the
latency increases to the point that responsiveness has slowed noticeably; however, configuration and image uploads can still
succeed. It changes to orange when connectivity issues reach the point that configuration and image upload attempts might no
longer be successful.


