


724-746-5500 | blackbox.com
724-746-5500 | blackbox.com
Page 25
Chapter 2: Preparing for a WAN Deployment
Run Time:
The run time determines how long the scanning process lasts. The default run time is five minutes, which is generally
long enough to get a rough idea of the RF (radio frequency) environment. For more intense scrutiny of the RF environment,
longer run times are called for. The maximum run time is eight hours.
Return:
The Return button returns you to the Monitor > Access Points > SmartPath APs page without stopping the analysis.
When you return to the Monitor > Access Points > SmartPath APs page, an icon appears to the right of the SmartPath AP name
indicating that the spectrum analysis feature is enabled, which means that an analysis is running. To return again to the spectrum
analysis page, simply click this icon or perform the same steps to start an analysis. Attempting to start an analysis while one is
already running does not start a new instance; rather, it returns to the view of the current analysis in progress.
Stop:
When you click “Stop,” the current analysis ends. SmartPath EMS VMA appliance allows for 10 concurrent scans, and
SmartPath EMS Online displays the Monitor > Access Points > SmartPath APs page again.
Maximize:
Clicking the maximize button (four outward-pointing arrows) on the status bar causes the entire pane to be maxi-
mized to fill the browser frame. To return to the normal view, simply click the Restore Down button (four inward-pointing arrows)
in the upper right corner of the browser.
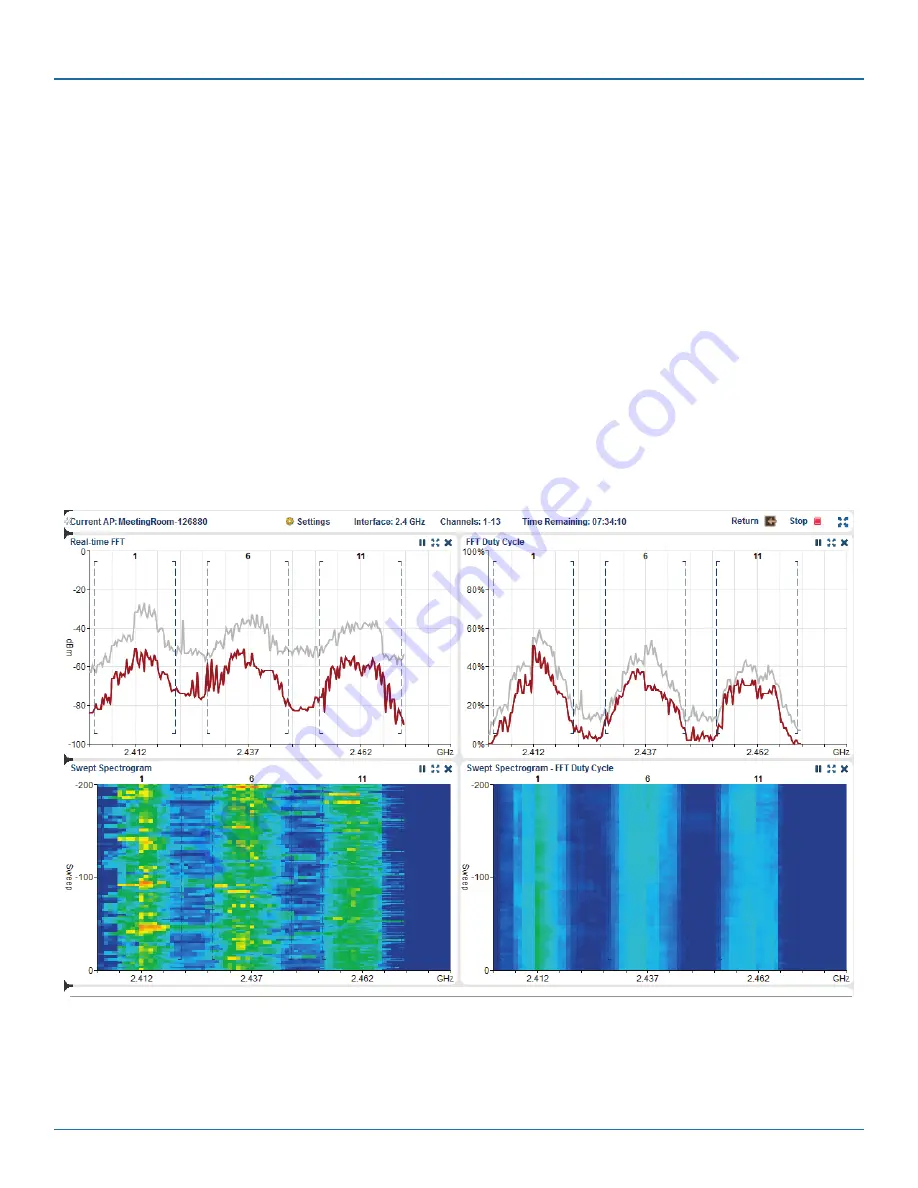
Graphical Analysis Feedback Area
The graphical analysis feedback area displays four representations of the received signals, arranged by default in a two-by-two
array.
Figure 2-9. Graphical analysis.


