


16
In this section, you will be able to study graphs which may appear on your screen at some stage
of your work with the PCRun Reader. The shape and size of the graph, which appears during
a reaction is affected by the quality of the sample used for the test. In addition, the surrounding
environment can affect the results. Make sure that the Reader has been placed on a solid table
away from any machinery that may cause vibration and in an area where there is no strong or
direct light.
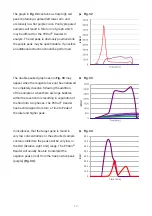
A positive result should have the appearance of
a clear histogram shape, as seen in
Fig. 29.
9. Analyzing PCRun Graphs
®
®
Fig. 29
The graph in
Fig. 30
may be observed if the
PCRun Reader has been placed on a surface
which receives mild vibrations. At the end of the
run the Reader may even interpret some of the
peaks as positive if they have a Gaussian shape.
The recommendation is to move the Reader to a
more suitable area and repeat the test.
®
Fig. 30
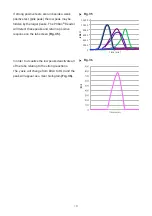
The peaks in
Fig. 31
are clear, but to the right of
the curve, low peaks with a flat top are present.
This phenomena can occur if the lid of the
Reader is disturbed briefly during the run or if
there has been a short change in the electrical
current. In most cases the internal analysis
program can deal with such situations, but if the
secondary peaks are higher than the primary
peaks the machine may return an inaccurate
Time to Peak value and the test should be
repeated if necessary.
Fig. 31


