12
3.7
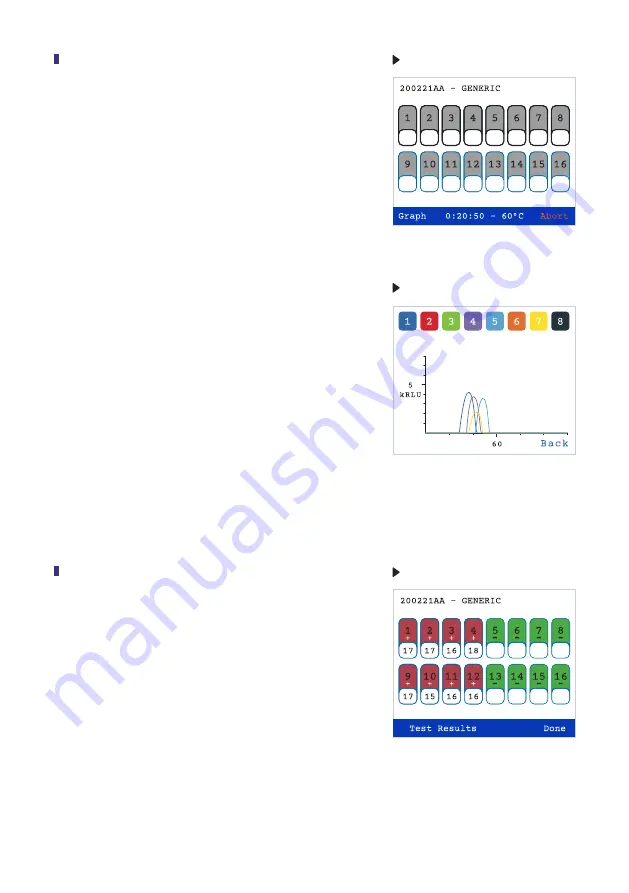
During the amplification process, the screen can
be switched to a histogram plot by pressing
Graph
located on the bottom left hand side of the screen
(Fig 18)
. Using the stylus, press each number on
the tab screen, which represents the sample to be
viewed. The activated tabs will be accented with a
black border. (The graph screen can display only 8
samples at a time). Activate the
Graph
command.
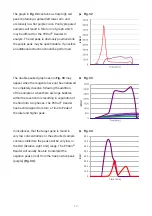
The graphical display will appear. A row of color
coded numbers can be seen above the graphs
(Fig 19).
The numbers and colors correspond to the
activated sample wells. Return to the numbered tab
screen by activating
Back
(lower right side of the
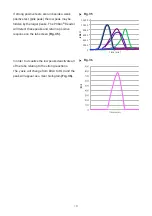
screen). Positive reactions will be seen on the graph
screen as the reaction progresses at any time point
of the run. If a reaction is positive, the numbered
rectangles on the tab screen will change to red and
the time at which the reaction was at its maximum
(Time to Peak) will be noted under the positive sign.
Different from the positive results, the negative green
results will appear only at the end of the run
(Fig 20).
Fig. 18
Fig. 19
3.8
Once the reaction is complete activate
Done
on the
lower right side of the screen
(Fig. 20).
The heating
unit of the Reader will turn off automatically if not in
use for 15 minutes.
Fig. 20


