11
Tips: Press and hold the left mouse button to drag a box in the graph, when the left mouse button is
released, the graph will be redraw with the data in the selected rectangle area. Click right button, then
the graph will be redrawing with all the data in the logs file.
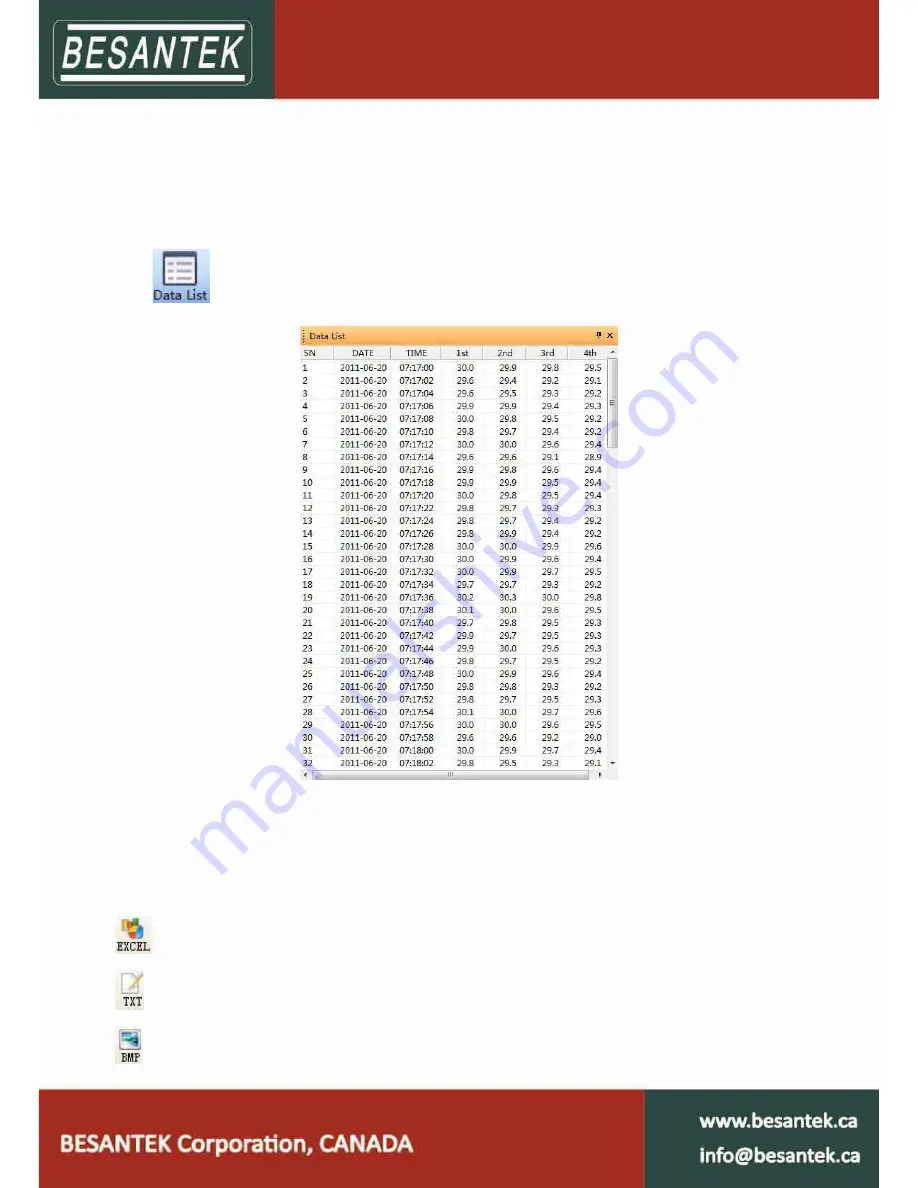
2.5 Data Listing Window
Click
button on the toolbar, and then the data listing window is shown below.
The data pane lists the data samples collected by the logging device.
The column width of each column is adjustable by using the left mouse button and dragging the column the
desired width.
2.6 Exporting Logs from BST-Software
: Export sample data to an Excel file.
: Export sample data to a text file.
: Export graph to a BMP file.


