The information contained in this document is the property of Automatic Systems and is confidential. The recipient shall refrain from using it for any purpose other than the use of the
products or the execution of the project to which it refers and from communicating it to third parties without prior written agreement of Automatic Systems. The document is subject to
change without notice.
Smart n' Slim MP-MT-EN
p
34/40
#Configurer M340-MT-FR-00#
3.7.1. Usage statistics
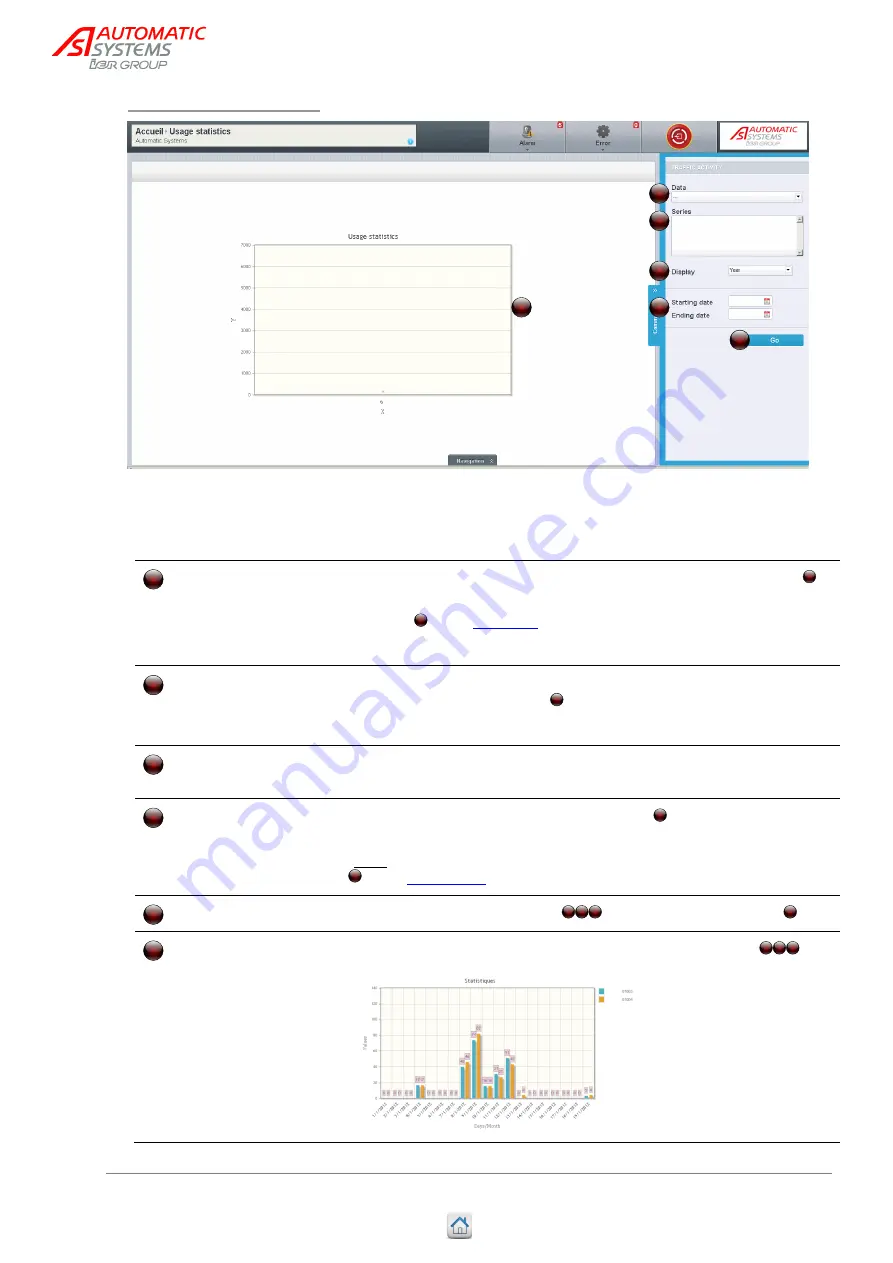
This page is used to visualize the counters for a specific time period.
Data
List of available data that can be selected to generate the histogram .
This list contains values for the counters available for the desired lane(s)
(see item of the
Select a counter in the scroll list to display it in the Series field.
Series
This field contains the list of the data included in the histogram, as they
have been selected from data .
Click on a data to remove it from the list.
Display
List used to select the scale of the histogram (hours, days, months,
year); this scale is used for the x-axis of the histogram.
Starting date/Ending
date
Time range for the data selected in the series (i.e., minimum and
maximum values of the x-axis of the histogram).
*Note
: The reference is the date displayed on the monitoring panel (item
of the
Go
Confirms data selected in items
and creates the histogram .
Histogram
Histogram created with the data selected through parameters
.
5
4
2
7
7
5
4
2
6
8
2
5
4
1
2
3
7
1
1
2
4
5
6
7


