Armfield Instruction Manual
Toolbar
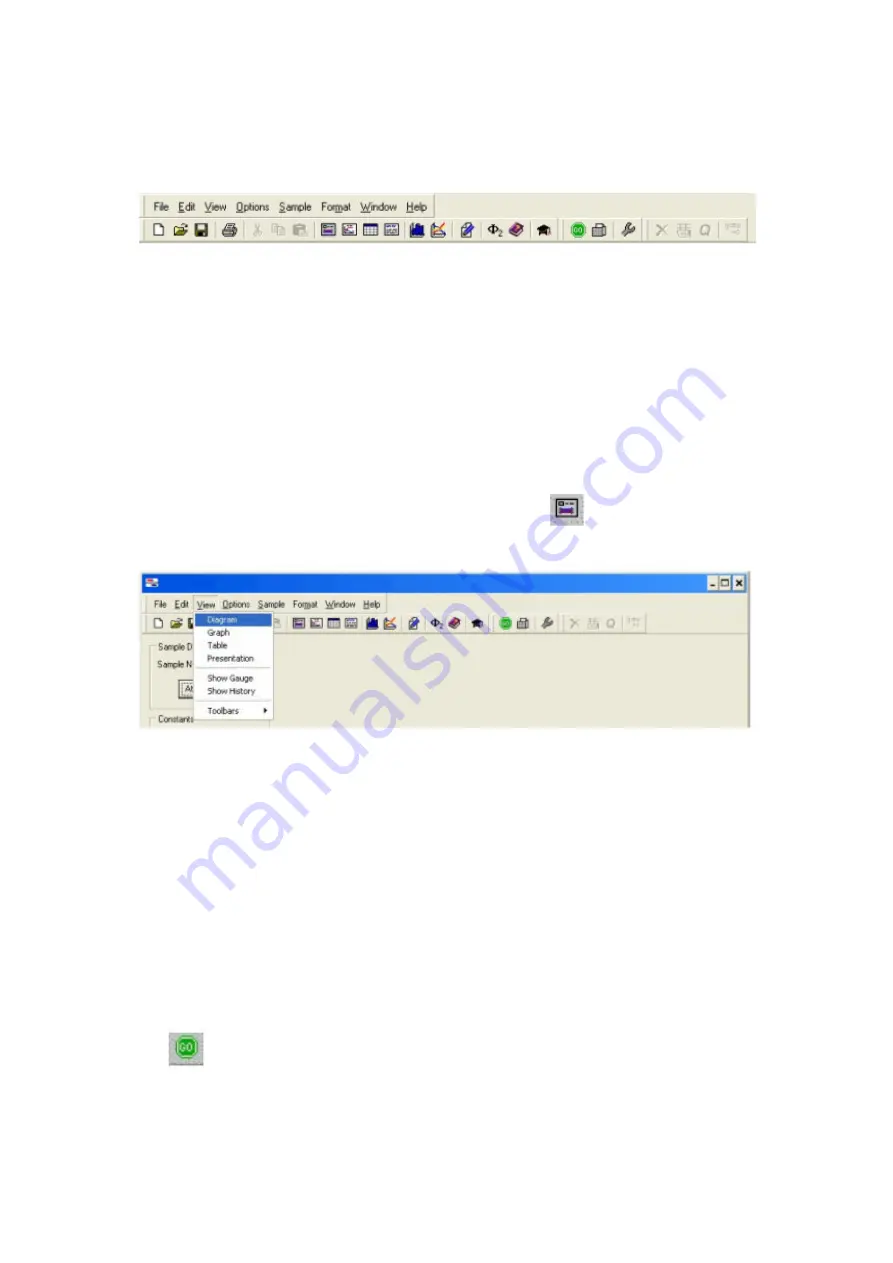
A toolbar is displayed at the top of the screen at all times, so users can jump
immediately to the facility they require, as shown:
The upper menu expands as a dropdown menu when the cursor is placed over a
name.
The lower row of icons (standard for all Armfield Software) allows a particular
function to be selected. To aid recognition, pop-up text names appear when the
cursor is placed over the icon.
Mimic Diagram
The Mimic Diagram is the most commonly used screen and gives a pictorial
representation of the equipment, with boxes to enter measurements from the
equipment, display any calculated variables etc. directly in engineering units.
To view the Mimic Diagram click the View Diagram icon
from the main tool bar
or click
Diagram
from the
View
drop-down menu as shown:
The mimic diagram displayed will depend on the accessory connected to the F1-10.
Refer to ‘Operating the Software’ in the instruction manual supplied with the
accessory for more details about the mimic diagram displayed.
Manual data input boxes with a coloured background allow measured variables,
constants such as Orifice Cd and Atmospheric Pressure, as appropriate, to be
changed by over-typing the default value. After typing the value press the Return key
or click on a different box to enter the value.
In addition to measured variables such as Volume, Time, Temperature or Pressure,
calculated data such as Discharge / Volume flowrate, Headloss etc are continuously
displayed in data boxes with a white background. These are automatically updated
and cannot be changed by the user.
After entering a complete set of data from measurements on the equipment click on
the
icon to save the set of results before entering another set.
The mimic diagram associated with some products includes the facility to select
different experiments or different accessories, usually on the left hand side of the
screen, as shown:
14


