UG-702
ADA2200-EVALZ User Guide
The center frequency of the filter is located at 1/64 of the clock
frequency. As shown in Table 3, this is equivalent to 1/4 of the
Nyquist frequency of the output rate. With the on-board 400 kHz
oscillator, this center frequency is located at 6.25 kHz.
The filter transfer function scales with the input clock frequency.
Valid input clock frequencies range from 10 kHz to 1 MHz.
Sweeping the input clock frequency in this range sweeps the
filter center frequency from 156.25 Hz to 15.625 kHz. The filter
Q remains constant at 1.7 for any CLKIN frequency.
Connect Pin 1 and Pin 2 on P13 to use an external clock with
the device.
Programming Different Filter Configurations
If the desired filter is different from the default definition, the
must boot from an EEPROM previously programmed
with valid contents for all the user registers. For additional details
on how to boot from EEPROM, refer to the Programming the
section.
For information on programming the EEPROM with a different
filter function, contact
SIGNAL MEASUREMENTS
The signal present at the output of the
depends on
the amplitude and phase (relative to the reference clock) of the
signal applied at its inputs. When either the amplitude or phase
is known and constant, any output variations can be attributed
to the modulated parameter.
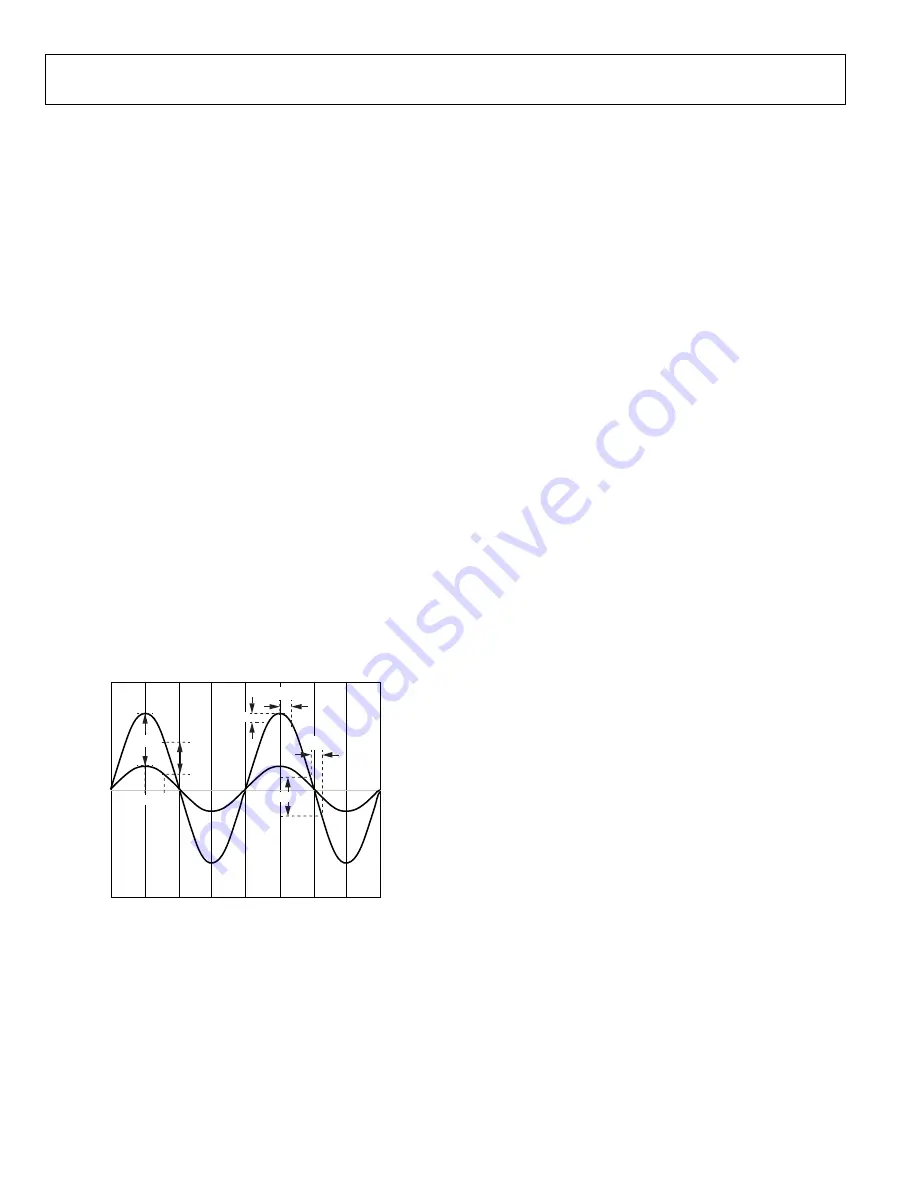
This dependence is shown in Figure 4. In any of these cases,
the
is performing either amplitude or phase
demodulation.
0
0
180
0
180
0
A
MPL
IT
U
D
E (V)
PHASE (degrees)
ΔA1
ΔA2
θ1 θ2
ΔA1
ΔA2
Δθ
Δθ
90
270
90
270
12359-
004
Figure 4. Measurement Dependence on Phase and Amplitude Variations
includes a 10 Hz low-pass filter, which
converts the demodulated signal to a dc voltage level. This
conversion makes it possible to use a simple voltmeter to
perform amplitude and phase measurements.
Amplitude Measurements
If the phase of the signal present at the inputs of
remains constant, the output behaves as a linear function of the
signal amplitude. In other words, if the amplitude of the signal
doubles, the output voltage also doubles.
The relationship between the signal amplitude and the output
level depends on the relative phase between RCLK and the
signal. This relationship is analogous to measuring the
amplitude of a signal by looking at its crest (maximum
amplitude point) or zero crossing. When the signal amplitude
changes, the voltage at the crest sees the greatest change. In
contrast, the zero crossing remains at zero. Because these two
points are 90 degrees from each other, they are in quadrature.
If the relative phase of the signal makes the amplitude
measurement too small to measure, toggle the switch labeled
EEPROM_BOOT and press the
RESET
button. This action
allows the
to boot with the EEPROM contents, which
are the same as the default configuration, except that the
demodulates the quadrature component instead.
Phase Measurements
If the amplitude of the signal present at the inputs of
remains constant, the output varies as a function of the relative
phase between the signal and the reference clock (RCLK).
As long as the phase shifts are small, this relationship is
approximately linear; however, the gain (slope) of this
relationship depends on the relative phase shift between the
signal and RCLK. For example, if the phase shift occurs around
the crest of the signal, the change at the output is barely
noticeable. In addition, the user is not able to distinguish
between a positive and a negative shift. In contrast, the
maximum phase sensitivity is achieved when the phase shift
happens around the zero crossing. Because these two points are
90° from each other, they are in quadrature.
If the relative phase of the signal makes the phase measurement
too small to measure, toggle the EEPROM_BOOT switch and
press the
RESET
button. This combination allows the
to boot with the EEPROM contents, which are the same as the
default configuration, except that the
demodulates
the quadrature component instead.
Rev. 0 | Page 6 of 10


