background image


Scope_manual_en-v110.docx 

— 72 — 


Chap. III - Special tests

1. 

INTRODUCTION 

This software makes performing of certain ignition and diesel engine measurements and tests easier and quicker; 
it  automatically  adjusts  the  instrument  for  the  selected  measurement  or  test.  In  some  cases,  engine  speed  is 
displayed together with the measured signals. Available tests depend on the instrument configuration. 


1.1 

SPECIAL TESTS PROGRAM INITIALIZATION 

After installing the 

Multi-Diag Scope

 program (see Chap. I - 9.2), connecting the 

Motortester

 module (see Chap. 

I - 2) and starting up the program (see Chap. I - 12), the application can be initialized by clic

king on the “

S

“ icon 

(see the cursor in Fig. 163)


Fig. 163 

– Tab for switching over to Special tests (figure applies to version 7.2.4) 


1.2 

DESCRIPTION OF TESTS 

After  selecting  a  test,  the  instrument  will  automatically  choose  such  electrical  measurement,  which  is  best  for 
checking of the element or signal. Parameters of the measurement are set so that the measured value/course 
were displayed optimally.  


1.3 

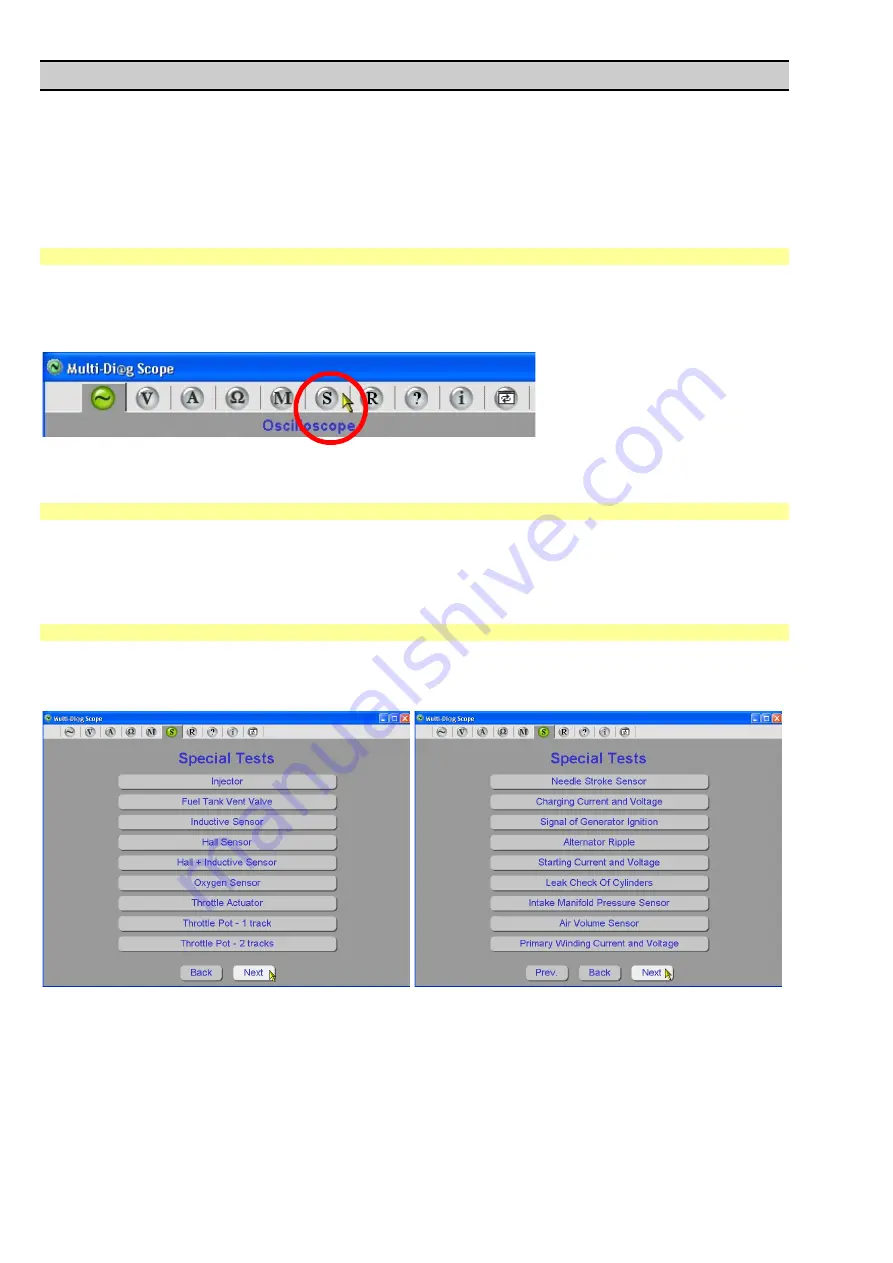
LIST ALL AVAILABLE TESTS 

Fig. 164 until Fig. 166 list all available tests. The names of individual special tests were mostly chosen so that 
they suggest their use. 


Fig. 164 

– Special test – First page of the menu 

Fig. 165 

– Special test – Second page of the menu 


Summary of Contents for Multi-Diag Scope

Page 1: ...ANUAL Last updated April 29 2016 The right is reserved to change the Manual ref T540 0301 ACTIA CZ s r o Lesní 47 390 01 Tábor Horky Czech Republic Phone 420 381 410 100 Fax 420 381 253 043 e mail info actia cz web http www actia cz Scope_manual_en v110 docx ...

Page 2: ...FROM THE SCREEN ONLY 29 14 2 14 PRINTING OF DISPLAYED WAVEFORMS 30 14 2 15 OSCILLOSCOPE USER SETUP SAVING LOADING 31 A USER SETUP STORAGE OPTIONS 31 14 2 16 DESCRIPTION OF CONTROL BUTTONS 34 14 2 17 DESCRIPTION OF SELECTED FUNCTIONS 34 EXAMPLE OF USING THE MODE FOR OPENING BOTH CHANNELS TWO POLE COIL 35 14 2 18 ERROR MESSAGES 37 14 3 VOLTMETER 37 14 4 AMPEREMETER 38 14 4 1 CURRENT PROBE 5 50 A 39 ...

Page 3: ... PARAM MENU 70 7 1 1 EDIT SETUP BUTTONS 70 7 1 2 CONFIRM DELETE BUTTONS 71 CHAP III SPECIAL TESTS 72 1 INTRODUCTION 72 1 1 SPECIAL TESTS PROGRAM INITIALIZATION 72 1 2 DESCRIPTION OF TESTS 72 1 3 LIST ALL AVAILABLE TESTS 72 2 HELP SENSOR CONNECTION 73 2 1 VIEW OF MOTORTESTER 73 2 2 MAIN HELP SCREEN 73 3 SWITCHOVER TO ANOTHER APPLICATION 75 CHAP IV RECORD ANALYZER 76 1 INTRODUCTION 76 2 RECORD ANALY...

Page 4: ...essories d The covers from the device shall not be removed e The keeper of the device shall secure the training of operators in the safety regulations for service workplace and in vehicle manufacturers regulations valid for tests with the engine running f Service workplace shall be equipped with the specified exhauster of fume exhausts from the measured vehicle 3 AMBIENT CONDITIONS Operating tempe...

Page 5: ...roduct and the accessories packed together constitute the applicable product according to the WEEE directive except batteries 6 PC REQUIREMENTS Windows 2000 XP Vista 7 8 1 10 Processor Intel Pentium 400 MHz compatible and faster VGA 800x640 16bits RAM 512 MB CD ROM drive Free RS 232 or USB port 7 MULTI DIAG SCOPE CONNECTION WITH PC Fig 1 Multi Diag Scope connection through RS 232 to Notebook Varia...

Page 6: ...g 7 Power supply of Multi Diag Scope Variant 1 oldest version VCI vehicle communication interface module is powered through the OBD connector Fig 8 Power supply of Multi Diag Scope Variant 2 VCI vehicle communication interface module is powered through the OBD connector 1 Multi Diag Scope Interface communication interface 8 Supply adaptor vehicle communication interface 9 Supply adaptor battery A ...

Page 7: ...installation may take several seconds Click on Finish to complete the installation The pre installation of drivers for the RS232 USB converter starts after its completion see Chap I 10 2 1 Note The default language of the Wizard is English but it can correspond to your language version of Windows 9 3 PROGRAM CONFIGURATION Before the configuration program start you shall a exit the Multi Diag Scope...

Page 8: ...ICATION ON THE SCREEN When the auto update is in progress in Multi Diag Scope or in the Motortester module this state is indicated on the screen with the Loading firmware flashing message see the cursor in Fig 12 9 4 2 AUTO UPDATE INDICATION ON MULTI DIAG SCOPE When the auto update is in progress in Multi Diag Scope or in the Motortester module this state is indicated with a flashing LED indicator...

Page 9: ...drivers for the RS232 USB converters After the start of the installation wizard see Fig 16 as the first step the search for older invalid drivers takes place see Fig 17 The following series of figures was taken from the installation wizard for the Windows XP operating system The wizard for Windows Vista is similar but with a different picture Fig 16 Start of the pre installation of RS 232 USB conv...

Page 10: ...e process of installation several times and it is possible to ignore it without any concerns When the installation of the new drivers is completed a notification is displayed informing about the need for restarting the system see Fig 21 It is recommended to perform this restart b If up to date drivers are detected the information about their presence will be displayed see Fig 21 and the Multi Diag...

Page 11: ...l modes save the Frequency 1 10000 Hz scanned time slope into the memory as a files 11 2 MULTIMETRE Parameter Sensor Type Range Resolution Accuracy Notes DC Voltmeter Probe A B Oscilloscope part of the oscilloscope 0 2 V 2 20 V 20 400 V 1 mV 10 mV 0 1 V 1 5 of MV 5 mV 1 5 of MV 20 mV 1 5 of MV 0 2 V AC Voltmeter Probe A B Oscilloscope part of the oscilloscope 0 2 V 2 20 V 20 400 V 1 mV 10 mV 0 1 V...

Page 12: ...an see the Multi Diag Scope screen Fig 33 Fig 25 Initialization window when starting up the Multi Diag Scope program from 7 1 version 12 1 ERROR MESSAGE WHEN MULTI DIAG SCOPE IS DISCONNECTED If an error message see Fig 26 is displayed after the program is started up the cause shall be find out power supply communication port license and so on and then you shall try to restart the program up Fig 26...

Page 13: ...controlled with the control pencil by touching the respective symbol or by it s moving on the screen Hereinafter only the control by means of the mouse is mentioned however in the case of the touch screen the mouse is replaced with the control pencil and therefore by mentioning the mouse we imply the control pencil 14 1 CONDITIONS FOR MAXIMIZING THE OSCILLOSCOPE WINDOW RECOMMENDATION After the pro...

Page 14: ...ing the oscilloscope it is recommended to hide the main panel Fig 32 Activating the main panel hiding function 14 2 OSCILLOSCOPE 14 2 1 BASIC SCREEN Notice The following set of figures describes the independent oscilloscope The figures were mostly taken from the Multi Diag Scope 1 00 version eventually from 4 0 5 1 6 1 7 3 or 10 1 versions However the description is identical for all versions For ...

Page 15: ...ding Record triggering control and setting Control and setting of input sensitivity A and B channel switch off Button to invert the displayed signal Control and setting of time base Button to start waveform recording 2 3 5 6 7 8 1 Fig 33 Multi Diag Scope window after the program is started figure applies to version 10 1 Note to Fig 33 Links to the chapters describing the specific function 1 see Ch...

Page 16: ...t you hide the main panel to be able to use maximum space for displaying the oscilloscope see Fig 32 Control panel minimization icon 1 Fig 34 Control panel before it is minimized hidden At this moment the new function for showing the control panel is activated button pos 2 Fig 37 indicating the minimization of the control panel To show maximize the control panel you can choose one of the following...

Page 17: ...scope s workspace is now significantly larger thanks to the minimization of the control panel Hovering the cursor near the black arrow pos 2 Fig 35 the panel is automatically shown after 2 seconds but it is again automatically hidden after 5 seconds Clicking on the black arrow pos 2 Fig 35 the panel is immediately maximized but it is automatically minimized after 5 seconds ...

Page 18: ... of Multi Diag Scope individual functional modes Record triggering control and setting Visualization of the position of the displayed part of the record trigger level position and the position of cursors within the entire record Fig 36 Description of individual parts of Multi Diag Scope window in the Oscilloscope mode for two channel measurement with switched on cursors figure applies to version 7...

Page 19: ...hin the entire record Setting of trigger level position of the record Setting of trigger level size Trigger level position in the displayed window Visualization of trigger level size for the selected trigger channel Selected trigger mode Selection of trigger frequency range Selection of trigger source Note Visualization of the minimum and maximum voltage value of the displayed course for individua...

Page 20: ...l parameters figure applies to version 1 00 see Fig 40 Note see Chap I 14 7 SWITCHOVER OF CONNECTORS ON THE CHANNEL B The motortester connectors K2 K3 K4 and K5 with attached probes can be connected to the channel Ch B By clicking on the Ch B button you can gradually switch over between these connectors If a correct probe is connected to the connector the connector will get attached The descriptio...

Page 21: ... and setting of time base figure applies to version 1 00 14 2 7 DESCRIPTION OF THE INVERT CONTROL FUNCTION When the invert function is on the waveform is displayed in an inverted manner Activate the inversion of the waveform in channel A see Fig 43 by pressing the Inv A button see the cursor in Fig 42 By pressing this button again see the cursor in Fig 43 the waveform of the channel B becomes inve...

Page 22: ...rt function the screen shot is taken from the 10 1 version for illustration Fig 43 Waveform after the use of the Invert A function the channel A inverted Fig 44 Waveform after the use of the Invert B function the channel B inverted Fig 45 Waveform after the use of the Invert AB function both channels A and B inverted ...

Page 23: ...trol of right cursor position Cursor position towards the record start Difference between the voltage of the points of intersection of the displayed course and the left and right cursor Time distance of cursors Voltage value of the point of intersection of the displayed course and the left cursor Control of left cursor position Fig 46 Cursor measurements figure applies to version 1 00 ...

Page 24: ...recording Information about course recording state Automatic setting of oscilloscope parameters according to the course character of input signal Fig 47 Description of the function of other control buttons figure applies to version 1 00 Fig 48 Oscilloscope appearance during the setting of parameters after AutoSet function activation figure applies to version 7 2 4 ...

Page 25: ...and in this way oscilloscope parameters can be set Fig 49 Control of oscilloscope parameters by the mouse or pointer in the case of touch screen figure applies to version 1 00 Select the control button with the mouse cursor and by left clicking the setting of the respective oscilloscope parameter changes step by step Note Fig 50 Setting of oscilloscope parameters by clicking the relevant control b...

Page 26: ...erved now the waveforms are subject to a partial limitation because they cannot be either moved or zoomed change in the view size The new storage function involves essential data such as o measured values o signal parameters o trigger conditions Now two files can be opened at once o each file can include 2 waveforms channels o the display of these signals has been adjusted they can be zoomed and m...

Page 27: ...into the STOP mode prior to saving the waveform Fig 55 The oscilloscope is in the STOP mode pos 2 The waveform can be saved without any problems 14 2 12 OPENING WAVEFORMS When you click the button to open the file see Fig 56 a typical window is displayed in which you can select the waveform to be displayed see Fig 57 The registered waveform can be composed of one or two waveforms it depends on how...

Page 28: ...rm opening figure applies to version 10 1 Fig 57 Select the required waveform and open the file 1 Fig 58 When stored waveforms are displayed the oscilloscope setting for these waveforms will appear Fig 59 When two stored waveforms are displayed yet this button is out of function pos 1 If you hover the cursor near the waveform parameters see Fig 58 the name of the currently displayed waveform appea...

Page 29: ...ter identifiers see Note in Chap I 14 2 12 Another aid for easier orientation while deleting waveforms is the identification of the actual waveform displayed after hovering the mouse cursor near the buttons for deleting the specific waveform pair see Fig 64 showing the name of the currently active waveform e g Save_13 1_10h 7m osg Fig 63 Deleting two saved and displayed waveforms Fig 64 When delet...

Page 30: ...ed waveforms Fig 66 Terminating the function of waveform deletion 14 2 14 PRINTING OF DISPLAYED WAVEFORMS Press the button see Fig 67 to display another window where you can select the installed printers see Fig 68 and print all of the displayed waveforms see Fig 69 Fig 67 Printing the displayed waveforms Figure from version 10 1 only for illustration Fig 68 Typical window for printer selection ...

Page 31: ...e saving steps Fig 70 to Fig 76 for the oscilloscope user setup and for its loading Fig 77 to Fig 80 a later time are shown on the following series of screen shots A USER SETUP STORAGE OPTIONS Run the function of saving the user setup by clicking the button see Fig 70 You can choose from two saving options Fast to application If you click one of the ten positions the setup is immediately saved and...

Page 32: ...s including spaces and then confirm the change by pressing the OK button see Fig 73 Click the cross to close the window see Fig 74 Fig 72 You can rename the current setup by clicking the right mouse button maximum 20 characters including spaces Fig 73 After you rename the setup e g Test confirm the change by clicking the OK button Click the cross to close the window Fig 74 Click the cross to close...

Page 33: ...up loading function by clicking the button see Fig 77 You can choose from two loading options Fast from application Click one of the ten positions to load the setup see Fig 78 Fig 77 Loading the oscilloscope user setup Fig 78 Choose one of the ten positions to open the setup Permanent from file If you choose this option you can load the oscilloscope setup from a file e g Test oss from a storage de...

Page 34: ...eleased or the limit is reached Information which oscilloscope parameter is set by the respective button Current value of the respective parameter and unit in which it is stated Current function which can be set by the respective button and which is represented by a graphic symbol or a text By left clicking the function that can be selected by the respective button is changed and the symbol or tex...

Page 35: ...hen the scanning stops STOP status Source Ch A Source Ch B The selection of channels whose input signal is used for the record synchronization Note 1 new in SW 10 1 Starting from version SW 10 1 you can open a record by a Trigger also from a turned off channel applies to both channels A and B Note 2 new in SW 10 1 Mode of opening both channels Starting from version SW 10 1 you can set the Trigger ...

Page 36: ...l the adjustment of the input so that the input signal can be suitably displayed in the window in the vertical direction The respective displayed datum is indicated in one division div of the raster of the window of displayed courses Pos Ch A The A channel position in the window of the displayed course the whole course of the A channel can be moved in the window upwards or downwards Ch A On Ch A O...

Page 37: ... in all Ohmmeter modes that the measuring probe is connected to the external power supply 14 3 VOLTMETER The oscilloscope cable probe Channel A plugged into connector Ch A is required for the measurement see Fig 86 Fig 86 Oscilloscope cable probe connected to Channel A input for voltmeter measurement Notes a Oscilloscope cable can be connected to both Channel A and Channel B for oscilloscope measu...

Page 38: ...e values Switching between D C and A C voltage measurement Adding a request to the printer queue For details refer to the chapter Printer queue Fig 89 Multi Diag Scope in the Voltmeter mode with the visualization of the minimum and maximum values of measured voltage figure applies to version 7 2 4 14 4 AMPEREMETER The current probe plugged into connector Ch B is required for the measurement see Fi...

Page 39: ...witch on the current probe is used for switching from 5 A 50 A ranges More see Chap Current probe offset zeroing 14 4 2 CURRENT PROBE 500 A AC DC current clamp probe is an accessories for Multi Diag Scope which is able to measure the electrical current up to 500 A DC 350A AC in frequency range up to 400 Hz During current measuring by this current probe it is not necessary interrupt the circuit or ...

Page 40: ...f all instantaneous current values from the measurement start i e after the amperemeter is switched on or after the reset by the RESET MIN MAX button Maximum value of current of all instantaneous current values from the measurement start i e after the amperemeter is switched on or after the reset by RESET MIN MAX Resetting of displayed MIN and MAX current values Switching on off of the visualizati...

Page 41: ...n is done in this moment Contact resistance suppression is recommended to use when small resistant value is measured 14 5 2 RESISTANCE MEASURING Measured resistance value Switch over to the resistance measurement mode Switch over to the conductivity test mode Switch over to the diode test mode Resetting of contact resistances of the measuring probe Adding a request to the printer queue For details...

Page 42: ...perates in the measurement mode of small resistances not exceeding 15 Ohms The measuring is accompanied by tone beeping by means of a PC sound card Measured resistance value Tone beeping 0 to 5 Ohms continuous beep 5 to 15 Ohms interrupted beep over 15 Ohm without beep the message Circuit open is displayed Fig 99 Multi Diag Scope in the conductivity test mode figure applies to version 7 2 4 14 5 4...

Page 43: ...HV probe N is used for measuring of the high voltage on the spark plugs by fitting the vehicle HV cable see Fig 101 During measuring on HV cables when is required measuring of flashover voltage is necessary insert the High voltage reference cable between ignition cable and spark plug At this HV Reference cable then put HV probe N see Fig 102 Ground High Voltage probe N High Voltage probe N High Vo...

Page 44: ...urement of high voltage on one cylinder with a high voltage cables with HV probe C1 and HV Reference cable 14 6 3 MEASUREMENT OF SPARK VOLTAGE ON THE REFERENCE HIGH VOLTAGE see Fig 102 and Fig 104 14 6 4 MEASUREMENT ON THE HV COIL SECONDARY WINDING WITH TOUCH HV SENSOR The Touch HV sensor serves for the informative detection of HV courses on the ignition systems in particular on such systems where...

Page 45: ... the level of the driving signal Fig 108 The driving signal level is higher than the defined sensitivity of the channel Ch A the saturation area is hachured saturation area of the channel Ch A saturation area of the channels Ch A Ch B saturation area of the channel Ch A Fig 109 The driving signal level is higher than the defined sensitivity of channel Ch A the saturation area is hachured In channe...

Page 46: ...g its functioning i e for example during a driving test 15 PRINT QUEUE Print queue is used for easy and efficient printing of the data acquired from different instantaneous numerical measurements with the Motortester as well as the Oscilloscope Print queue functions like a storage location in which the user gradually saves records of the individual measurement results which he wants to print later...

Page 47: ...atically included on the printed document 3 Button used for exiting this menu 4 Button used for clearing deleting the print queue 5 Button used for displaying the print queue contents For further details please see the section Print queue preview below Chap I 15 2 6 Button used for adding a record to the print queue Before a record is added the user can include a comment on the record being added ...

Page 48: ... control buttons for each item 1 Enables or disables printing of the item 2 Enables modifications to a comment for this item 3 Clears deletes this record from the print queue Note Print queue works for numerical measurements Printing of oscilloscopic graphs and time behaviours from the Record Analyser occurs separately and the graph is always printed on a different sheet Fig 112 Print queue previe...

Page 49: ...cessories to the Motortester you can construct a complete universal motortester for spark ignition engines and diesel engines 2 MULTI DIAG SCOPE AND MOTORTESTER CONNECTING PROCEDURE Fig 113 Multi Diag Scope Motortester connecting procedure 3 MOTORTESTER PROGRAM INITIALIZATION After installing the Multi Diag Scope program see Chap I 9 2 connecting the Motortester module see Chap I 2 and starting up...

Page 50: ...ENGINE MEASUREMENT The following measurement group is used exclusively for spark ignition petrol engines see Fig 117 and includes the following types of measurement Advance measuring Simultaneous voltage and current measuring Measurement on the HV coil primary winding o Voltage measuring on HV coil primary winding o Dwell angle measuring Measurement on the HV coil secondary winding o High voltage ...

Page 51: ...8 Missing button see Chap I 15 PRINT QUEUE The ignition sensor is used to indicate the ignition moment To determine the top dead centre you can either use the stroboscope or the inductive sensor or the semiconductor sensor STROBOSCOPE Stroboscope serves for determination of upper dead centre of crankshaft Measuring with the stroboscope is very simple Using buttons and see Fig 119 on the stroboscop...

Page 52: ...ith the inductive sensor or semiconductor sensor the advance value is being automatically calculated from the sensor signals and presented on the screen As there may be one or more marks on the flywheel of the measured engine and these marks may be shifted in regard of the top dead center it is necessary to have the possibility to enter these parameters in the instrument To do this use a special f...

Page 53: ...orner Press the function button to display maximal and minimal voltage and current values reached since the start of the measuring or since the button pressing along with the momentarily measured voltage and current Press the button once more to return to the previous display layout The button is used to compensate the direct current core magnetization For current probes 5 50A 500A is possible to ...

Page 54: ...ent probe Buttons for current probe selection Fig 123 Current and voltage measuring figure applies to version 7 3 Note to Fig 123 a Missing button see Chap I 15 PRINT QUEUE b In case of using new types of current sensors the buttons for current probe selection will respond to the used sensor In this case are used current probes 50 and 500A 5 3 MEASUREMENT ON THE HV COIL PRIMARY WINDING For the mea...

Page 55: ...n Fig 114 The voltage is shown so that the screen displays exactly one complete course between two contacts openings independently on engine speed see Fig 125 The horizontal axis scale of the screen is in crankshaft degrees per one division CS Div This way it is possible to monitor the breaker contacts course at different engine speeds and read the dwell angle as well Note The oscilloscope is set ...

Page 56: ...means of HV sensors that are connected to HV cables or to the ignition module The following options are available for the HV measuring on the secondary winding Single cylinder measurement All cylinders measurement Selected cylinder measurement Fig 127 Coil secondary winding measurement menu 5 4 1 TYPES OF HIGH VOLTAGE SENSOR AND THEIR USE IN MOTORTESTER 5 4 1 1 HV SENSOR N AT111 4018 For ignition ...

Page 57: ... you measure on more cylinders see Fig 132 to Fig 135 it is important to mark the first cylinder in the firing order with a black ignition sensor and to connect the grey ignition sensor so that its signal can inform the motortester about the firing point of the other cylinders If you measure on the single coil ignition the grey ignition sensor shall be connected between the coil and the ignition d...

Page 58: ... and black ignition probe of type N2 Ignition sensor N2 black color Probe grounding HV sensor N Fig 131 HV measurement on one cylinder system with distributor HV probe type C4 and black ignition probe of type N2 5 4 2 2 PROBE CONNECTION FOR ALL CYLINDER MEASUREMENT HV sensor C4 Ignition sensor N2 gray color Ignition sensor N2 black color Fig 132 HV measurement on all cylinders twin spark coil with...

Page 59: ...V probe type N and double ignition probe type N2 HV sensor C4 Ignition sensor N2 grey color Ignition sensor N2 black color Fig 134 HV measurement on all cylinders after distributor HV probe type C4 and double ignition probe type N2 HV sensor C4 Ignition sensor N2 grey color Ignition sensor N2 black color Fig 135 HV measurement on all cylinders before distributor HV probe type C4 and double ignitio...

Page 60: ... as a default This type of measurement is suitable for ignition systems with HV cables If this function is selected a high voltage bar chart for a single cylinder is displayed see Fig 137 or Fig 138 Fig 137 Single cylinder measurement average of the last 4 samples default setting Fig 138 Single cylinder measurement NOTE FOR FIG 137 AND FIG 138 ACCOUNT OF BUTTONS ON OFF Buttons and switch on and of...

Page 61: ...st and the second column course corresponds to the measurement at the time of the firing to the compression 5 4 4 ALL CYLINDERS MEASUREMENT The oscilloscope is set to optimum values as a default Because the HV sensor allows the measurement of up to 4 cylinders at the same time it is possible to display all max 4 cylinders simultaneously If you select this option the following screen is displayed s...

Page 62: ...rd cylinder Sensor 3 4th cylinder Sensor 4 2nd cylinder 5 4 4 3 DOUBLE COIL MEASUREMENT For vehicles equipped with double ignition coil and HV cables you can use this item Before measurement starts you should set the parameters appropriately see Chap I 7 In reality there are both positive and negative signals in twin spark coils Because the arrangement differs engine by engine so that the polarity...

Page 63: ...44 Polarity test of spark voltage waveform failed The waveform analysis can last up to tens of seconds In case of polarity test failure the message Fig 144 is displayed After the cause of the problem is removed the action can be repeated or the manual mode can be selected see Chap I 5 4 4 3A If the waveform polarity can be reliably detected the negative portions of signal are inverted into positiv...

Page 64: ...d Fig 147 Oscilloscope display of the HV course after the polarity detection and its conversion to the positive course and before the detection of the spark plug ignition time Fig 148 Spark voltage waveform compression exhaust phase recognized 5 4 5 SELECTED CYLINDER MEASUREMENT The connection is identical with the connection for the measuring on all cylinders see Chap I 5 4 4 but HV is displayed ...

Page 65: ...pressing the button you go to the HV oscilloscope measurement Here a new menu for switching over between cylinders is displayed see Fig 150 Cylinder selection buttons Fig 150 HV oscilloscope measurement on the selected cylinder 5 5 OIL TEMPERATURE MEASUREMENT When you select this function the screen displays engine speed and oil temperature if the thermometer is connected and inserted in the dipst...

Page 66: ...ope without the Motortester moreover the measured signal frequency is displayed in the status bar of the oscilloscope see Fig 152 Signal frequency Fig 152 Frequency measuring oscilloscope 5 7 SPEED ENGINE MEASURING OSCILLOSCOPE The visualization and control are the same as those of the Multi Diag Scope oscilloscope without the Motortester moreover engine speed is displayed in the bottom right hand...

Page 67: ...ng Pressure sensor signal measurement Oil temperature measuring Oscilloscope with the signal frequency measurement function Oscilloscope with the speed engine measurement function Fig 154 Basic screen for diesel engine measurement 6 1 PREINJECTION METER The preinjection meter function serves to measure the engine speed the preinjection dynamic start of fuel transport and eventually the oil tempera...

Page 68: ...ith the difference that we read preinjection values instead of advance values 6 2 VOLTAGE AND CURRENT MEASUREMENT This function is identical with the function described in Chap I 5 2 6 3 PRESSURE SENSOR SIGNAL This function serves to display the signal course from the pressure sensor mounted on the engine injection pipe see Fig 156 Fig 156 Pressure sensor signal measurement By moving the pressure ...

Page 69: ... necessary for some measurements to set the parameters of the engine and sensors The function button is available in the measurements requiring this setting see Fig 117 or Fig 154 By pressing this button a new MOTORTESTER SETUP menu appears Fig 157 Default setup of Motortester parameters after switching on the device for spark ignition engines or diesel engines Note Each time the device is switche...

Page 70: ...roke to simplify it the engine type is determined 2 stroke or 4 stroke However from the ignition aspect the four stroke engine without the ignition distributor with a double two output coil reacts as a two stroke engine 6 Sensitivity Here you can set the sensitivity of ignition or pressure sensor input It is recommended to change this value from the default value 5 only in the case the engine spee...

Page 71: ...ding to which you shall set the preinjection amount You can set 11 or 15 of the level from the maximum pressure signal level 12 Pressure sensor type this parameter can only be used with diesel engines The pressure sensor CAPELEC CAP is supplied as a special accessory for the device set But you can also use the AVL sensor You shall set the type of the used sensor in this option 7 1 2 CONFIRM DELETE...

Page 72: ...I 2 and starting up the program see Chap I 12 the application can be initialized by clicking on the S icon see the cursor in Fig 163 Fig 163 Tab for switching over to Special tests figure applies to version 7 2 4 1 2 DESCRIPTION OF TESTS After selecting a test the instrument will automatically choose such electrical measurement which is best for checking of the element or signal Parameters of the ...

Page 73: ...rly updated and informs the users whether the sensor is connected or not If the sensor is connected and is in the correct connector depending on the measurement type the connector indication is highlighted in green and the sensor name is written in the second column of the table If the sensor is not connected into the correct connector then it is signalled with red highlighting of the connector in...

Page 74: ... Connector indication Connected probe information Measurement list Fig 168 Main Help screen Sensor connection Green box Probe correctly connected to the connector Grey box No probe is connected to the connector Red box Incorrectly connected probe and its identification Brown circle Colour indication of Motortester connectors serves for a better orientation when connecting individual probes which a...

Page 75: ...his Help functions for both the Motortester and Multi Diag Scope without the Motortester but in the latter case there are only two connectors and fewer measurements can be selected Selected measurement Inactive connector Active connector Fig 170 Help for the selected measurement 3 SWITCHOVER TO ANOTHER APPLICATION The program allows to switch over to another application e g to Multi Diag or to oth...

Page 76: ...er into an animation string by the software The user can carry out the so called Zooming change of the view size depending on the setup of the time basis and input channel sensitivity on the recorded courses 2 RECORD ANALYZER PROGRAM INITIALIZATION After the installation of the Multi Diag Scope program see Chap I 9 2 and its starting see Chap I 12 the application itself can be initialized by click...

Page 77: ...perating memory see Fig 176 After it is completely loaded the Record Analyzer will be triggered Fig 177 After the negative confirmation no transfer will be carried out and the record will be lost beyond recovery Recommendation To be able to analyze the record later do save the record to your PC HDD USB Flash Disk etc by clicking on the icon symbolizing the floppy disk Pos 10 Fig 184 Fig 174 Screen...

Page 78: ...t beyond recovery Recommendation To be able to analyze the record later do save the record to your PC HDD USB Flash Disk etc by clicking on the icon symbolizing the floppy disk Pos 10 Fig 184 Fig 178 Screen of the continuous sampling oscilloscope time basis setup 100 ms to 2 5 seconds Fig 179 Information window for saving the record Fig 180 Basic screen after the record ending 100 ms to 2 5 second...

Page 79: ...ed from the oscilloscope memory to the PC These lost data are displayed as the above mentioned vertical black line on the screen You can interrupt the scanning by the repeated clicking on the Rec button see the cursor in Fig 173 or by the mouse clicking anywhere in the oscilloscope raster To display or to store the record you MUST positively confirm the message according to Fig 182 After the posit...

Page 80: ... a 2 b c d Fig 183 Basic screen after the record end oscilloscope time basis setup less than 1 ms 2 3 DESCRIPTION OF RECORD ANALYZER PROGRAM SCREEN 2 3 1 SCREEN WITH CURSORS OFF 12 13 14 2 3 4 5 6 1 7 8 10 9 11 Fig 184 Description of course analyzer screen ...

Page 81: ... depends on the setup according to Pos 1 7 Forward to the record end 8 Setup of the speed range 1 to 300 of the continuous playing of the record pre set for Pos 4 and 5 Note The range 1 300 determines the number of samples by which the signal is shifted approx every 100 ms depends on the Zoom and on the PC speed 9 Loading of a stored record e g Record_25 8_13h25m rec You can see the date and time ...

Page 82: ...ctivate this button it will change into and in this way the cursors will be switched on see Pos 24 and 25 Fig 187 13 Tools Set of buttons for carrying out the so called Zooming on the recorded courses change of the view size depending on the setup of the time basis and input channel sensitivity The specific set values are displayed in Pos 14 Fig 184 14 Information window displaying specific values...

Page 83: ...course intersections see Information window description in Chap I 2 3 3 20 21 Displayed data are always related to the centre of the display raster see Pos 21 specifically to the mouse cursor tip a Time info of the current position of the sample from the record beginning in minutes In this case it is the time of 0 00 966 minutes 966 ms b The current number of the displayed signal sample from the r...

Page 84: ...y using the mouse Fig 189 Change of cursor positions 2 3 4 IF THE CURSORS ARE BEYOND THE SCREEN If the cursors are not visible on the screen even though they are switched on and therefore should be visible on the screen the record has been shifted together with the cursors i e the cursors move together with the record and maintain their original position If the record is shifted so much that the c...

Reviews: