


ēKo Pro Series User’s Manual
Page
45
Doc. # 7430-0710-01 Rev. C
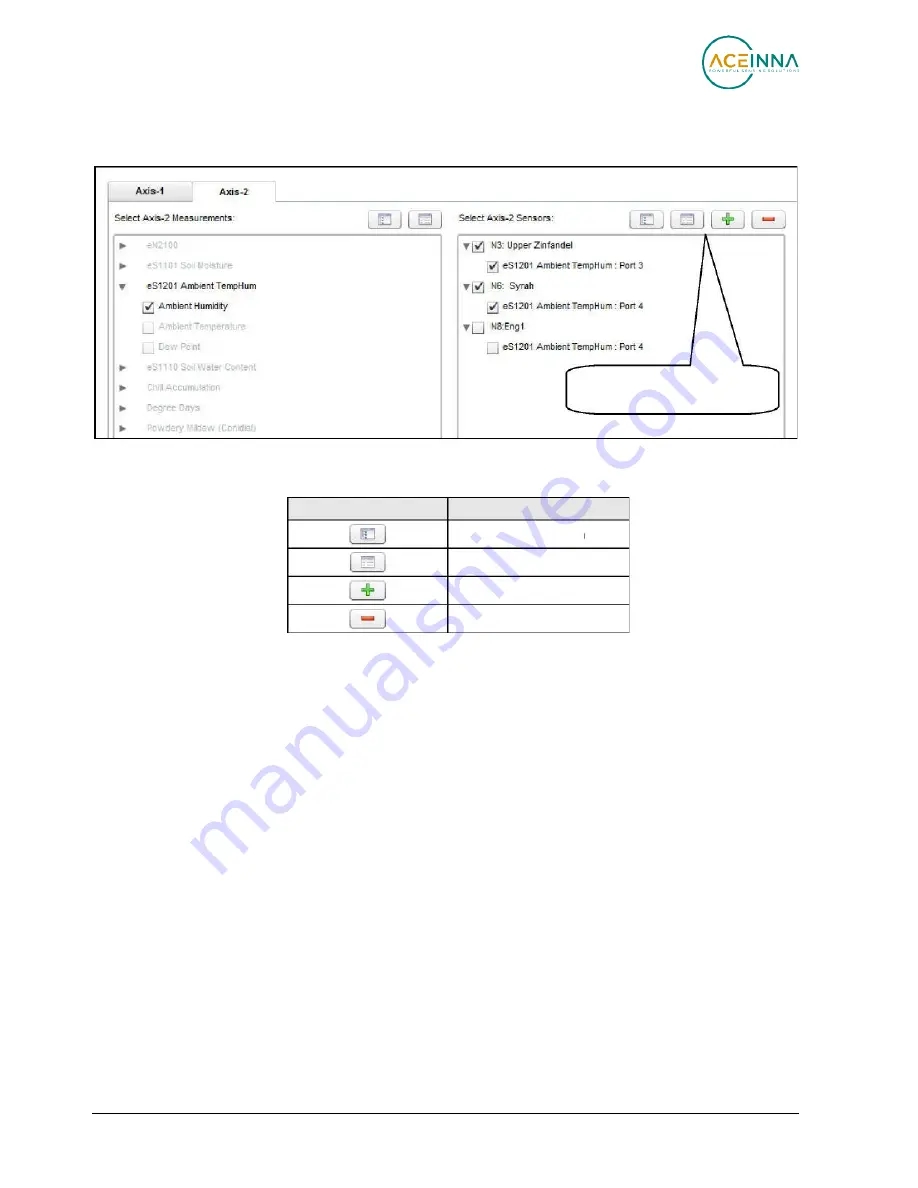
Sensor Chooser Icons
Chart Wizard Icon
Collapse All icon
Unselect All icon
Description
Expand All icon
Select All icon
4.
Sensors
: After selecting a Measurement type, ēKoView removes all ēKo nodes from the
sensor list that do not contain a sensor with the selected measurement type. Users can
now select the displayed ēKo nodes they want to plot on the right.
The chart wizard has several icons to simplify the selection of the sensors associated with
different nodes.
If an ēKo node contains several sensors that have the same measurement type users may
only wish to chart one of the sensors, using the
Expand All
button. ēKoView will show all
attached sensors. Then you can uncheck the sensors that you don’t want to plot.
5.
Plot Type
: Trend chart traces can be plotted in the following modes
Line graph : connects data points by lines
Point graph : single data points
High-low graph: display the maximum and minimum of data for aggregated data (i.e.
daily, weekly, monthly, yearly).
Bucket Graph: display the cumulative or average data in the form of bars (Daily,
Weekly, Monthly)


