ABT 7100
– Issue 02
22
STEP 5: Start Geometry Recording
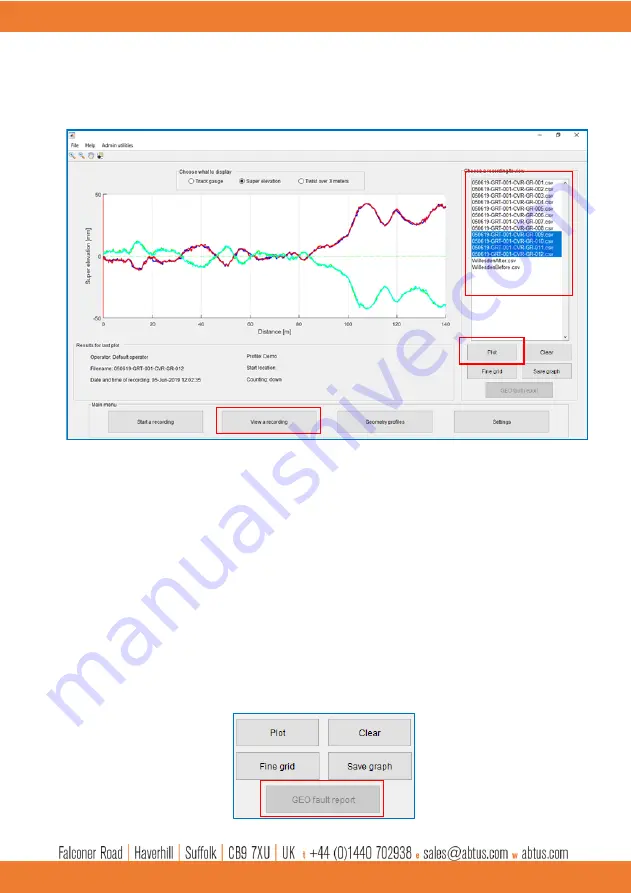
Press “
View a recording
” to open the results screen which is shown in
This will show the Results screen. You can choose to plot Track gauge, Super elevation or Twist
over 3 metres. Choose the recording by clicking on the name and press “
Plot
” to see the recording
graphically. This will also show the events that were added during the recording.
STEP 6: Opening CSV report
All recordings are saved in the “Recordings” folder in the software directory (
C:\ABT7100\recordings)
where the user can access the .csv reports. Figure 27 shows an example of such a report. The user
is able to view the position at which faults, such as Gauge and twist faults, occurred, where events
were recorded as well as various other information.
An additional fault report is created at the location ‘
C:\ABT7100\faultReports
’ after each geometry
recording is saved. This file exclusively shows recorded points that are outside the tolerance of the
active Geometry profile settings and can
be accessed by clicking the ‘GEO fault report’ button in the
‘View a recording’ screen.
Figure 26 Viewing track gauge results with events


