


Section 6 Status Displays
System Performance Display
3BUR002418-600 A
145
System Performance Display
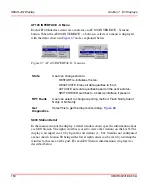
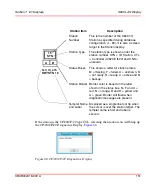
The CPU load performance display runs at a low priority. If the number of
Samples Since
count is not updating regularly, then the recommended loading
has been exceeded and the value on the display is incorrect because the CPU load
has spiked to 100%.
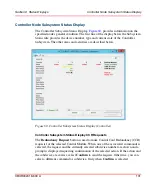
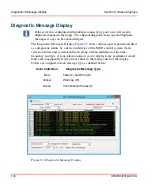
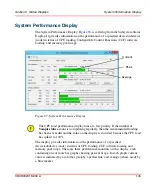
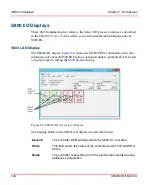
The System Performance Display,
, is called up from the Subsystem Status
Display. It provides information on the performance of a specified device/subdevice
(node) in terms of CPU loading, Configurable Control Functions (CCF) software
loading, and memory pool usage.
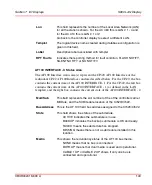
The display provides information on the performance of a specified
device/subdevice (node) in terms of CPU loading, CCF software loading and
memory pool usage. There are three performance monitors on this display, each
containing one or more bar graphs showing percent usage. In each graph, current
value is indicated by a solid bar, peak by a yellow line, and average (where used) by
a blue marker.
Figure 65. System Performance Display
Current
Peak
Average
Summary of Contents for Ability 800xA Series
Page 1: ...Power and productivity for a better worldTM 800xA for MOD 300 Operation System Version 6 0 ...
Page 2: ......
Page 3: ...800xA for MOD 300 Operation System Version 6 0 ...
Page 14: ...Table of Contents 14 3BUR002418 600 A ...
Page 74: ...Area Graphic Display Section 3 CCF Displays 74 3BUR002418 600 A ...
Page 102: ...Batch Connectivity to M0D 300 Section 4 TCL Displays 102 3BUR002418 600 A ...
Page 120: ...TLL Messages Section 5 TLL Displays 120 3BUR002418 600 A ...
Page 212: ...Viewing Abnormal State on MOD Loop Displays Section 8 Operation Examples 212 3BUR002418 600 A ...
Page 320: ...BRKPTS Appendix A Runtime Templates 320 3BUR002418 600 A ...
Page 322: ...Updates in Revision Index A 322 3BUR002418 600 A ...
Page 330: ...Index 330 3BUR002418 600 A ...
Page 331: ......


