P a g e
|
3
Innovated by
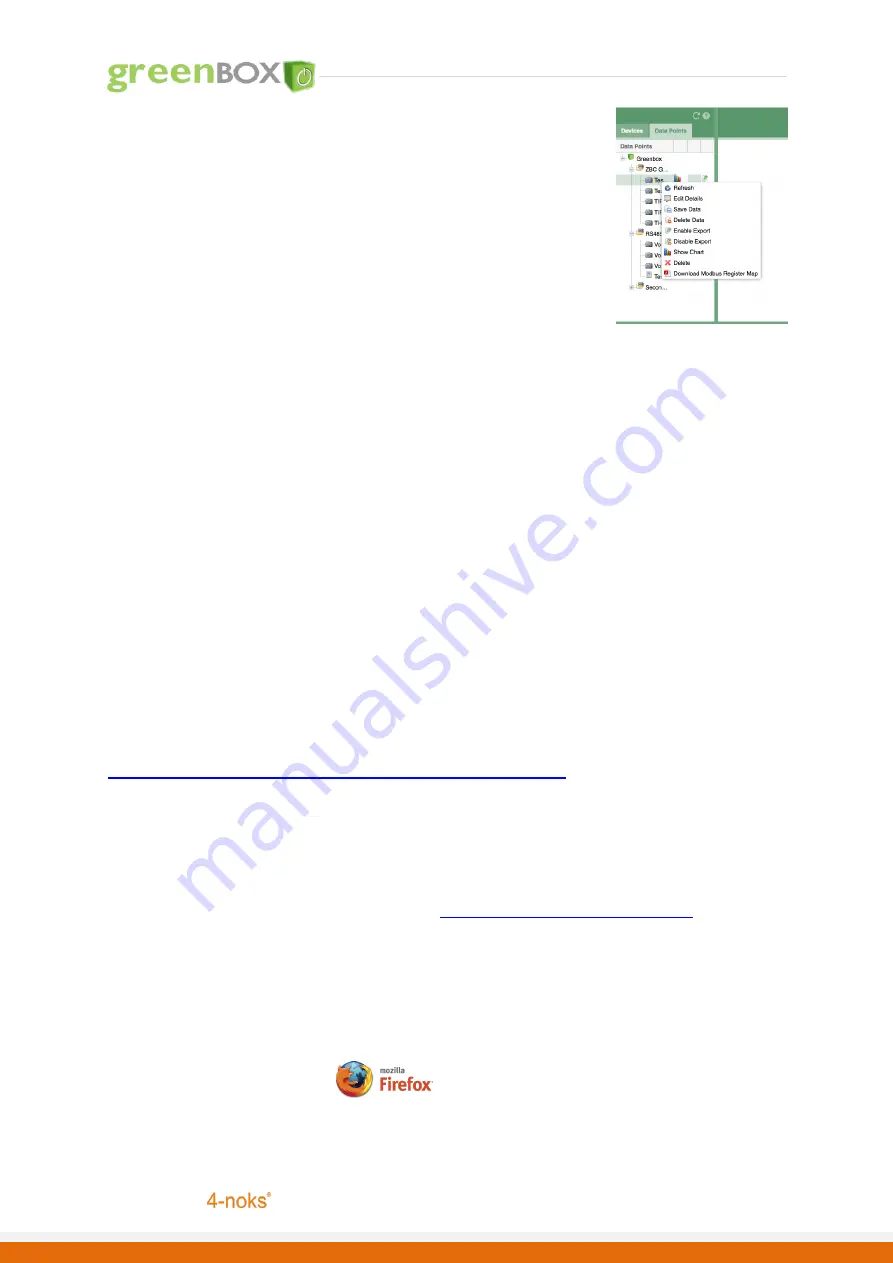
Saving Data
1.
Right click on the new data point within the Data Points Tree; from the context menu
select “Save Data”.
2.
A Chart icon should appear against the data point; this indicates that data will be
saved at the set intervals.
3.
Right click on the data point which you have saved the data for and select “Show
Chart” to display data and to download data using the export feature. Please note
that you should allow at least 1-2 hours for the chart to appear and display any data!
(See Technical User guide for more details)
Important Note:
Data Point Naming Convention
–
when assigning a name for a data/calculation point ensure it is meaningful succinct and unique
to differentiate between points. Use the description section to add more details.
Saving Data
–
Please ensure you are only saving data points which you require, do not save data for a point if it is not necessary.
This quick guide illustrates how to quickly get setup to access your GreenBox;
and also adding ZB-Connection devices. For more technical information on
how to use the additional functionality of the GreenBox please review the
technical user guide available online.
Technical Centre
|
Online User Guide, Technical Manuals & Downloads
http://www.zb-connection.co.uk/technical-centre
Username
Password
greenbox123
Support Queries or Bug Reporting
Green
Box
recommends you use