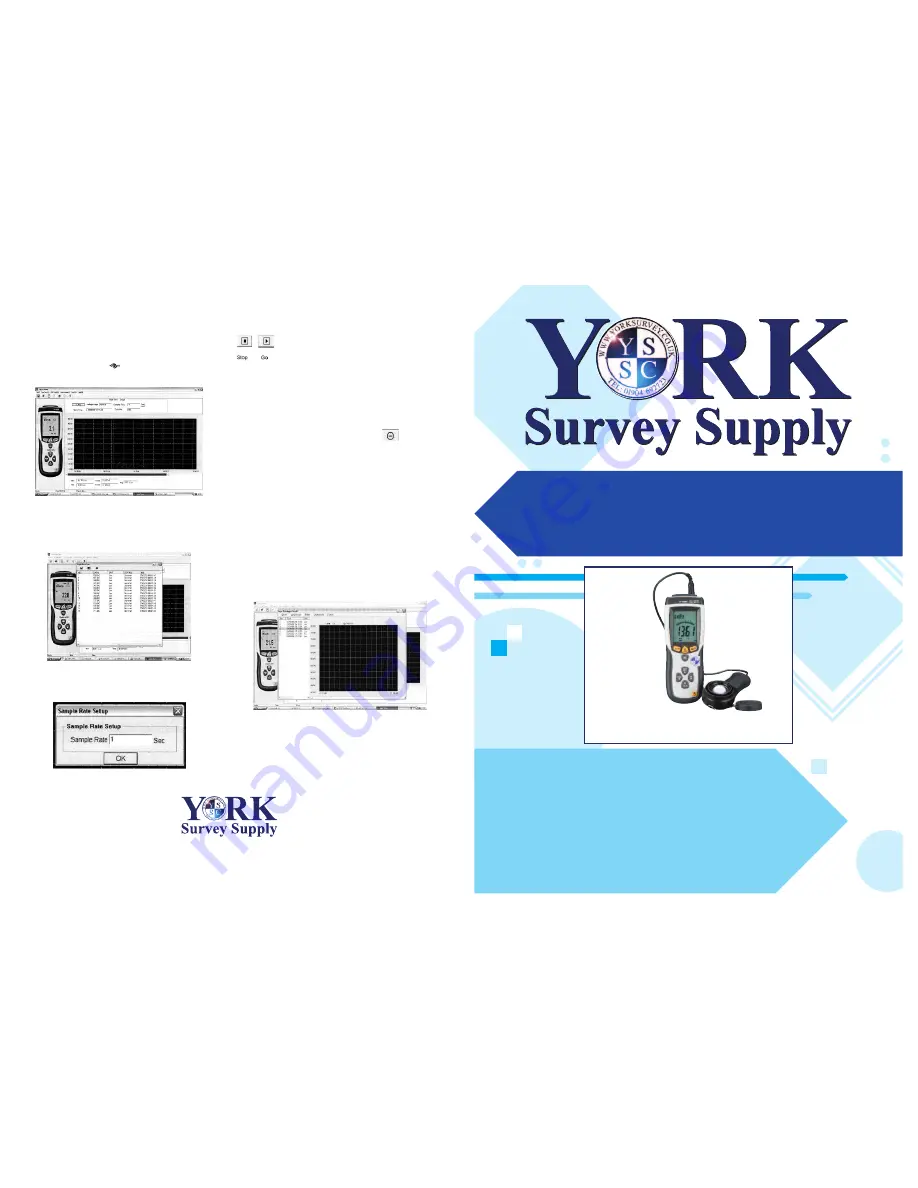
Code: 343660
Operating
Instructions
Ref:.. \operat98\instructions 18\343660.qxp 05-01-18
©York Survey Supply Centre 2018
Datalogging
Light Meter
Prospect House, George Cayley Drive, Clifton Moor, York, England YO30 4XE
Tel: +44 (0) 1904 692723 Fax: +44 (0) 1904 690385
E-Mail: [email protected] www.yorksurvey.co.uk
If the software still displays ‘
OFFLINE
’ there is no connection. To create
a connection, go to
Com Port (C)
icon (top menu line), click on the
drop down menu, select
Com3 (M)
. The light meter image on the
software should now be displaying the same information as your light
meter. In some cases this com port will not work and
Com4 (4)
or
another may have to be selected, by selecting
Other Com
and
choosing the appropriate com port where the information is being
displayed on the light meter. This works exactly as it would with
Com3 (M)
selected.
When the connection is made, on the top right side of the instrument
display you will see this symbol,
and the word “Scout”. The
software will show an image of the instrument and display measured
values the same as the instrument.
Reading the Recall 99 Memory Function via the Software
On the top menu line, click on
Mem(M)
. The software will now
download the memorised values and, when complete, auto open a new
window listing: - The Reading Number, Measured Value with the Time
and Date the measurement was memorised. This data can be saved or
printed.
General Recording Using the Software
Open the software and connect the instrument. On the top menu icons,
click on
RealTime(R)
. On the drop down menu, click
Run
. A new
window will open “Sample Rate Setup”.
The sample rate can be set from 1 second up to 99 seconds. Click OK.
The software will now log results from the instrument. Note: Data is
captured based on the date and time of the connected computer
irrespective of the date and time settings on the instrument.
To stop recording, click on
RealTime(R)
. On te drop down menu, click
Stop
.
Alternatively, recordings can be made using the Stop/Go buttons
located at the top of the software.
Viewing Saved Data
When stopped, the data can be viewed as a graph and by moving the
mouse over the data line, the time and measured value will be
displayed at the bottom of the software.
The graph has a zoom facility. Hold the right button of te mouse near to
the area, ten drag and draw a box to cover the data line. On releasing
the mouse button, the zoom will auto focus to the selected area. This
can be actioned 3 times for in-depth analysis.
To undo the zoom, click this icon in the top menu.
Datalogging
Ensure date, time and sampling rate are set correctly. Sample rate can
be set from 1 second up to 99 seconds.
Auto power off has to be disabled.
To set the instrument to record mode press and hold
REC/Setup
button
(No 4) until, in the top right corner of the display,
MEM01
appears. The instrument is now logging measured values as per set
sampling time. To stop datalogging, press and hold
REC/Setup
until
the
MEM01
disappears. To take a second set of data, repeat until
MEM02
appears. Multiple or single data logging sets can be stored up
to a maximum of 16,000 measurements. If the datalogger is full the
OL
will appear in the MEM sector.
To View Logged Data
Connect the instrument to the computer and open the software.
Click on
Data Logger(D)
icon on the menu bar at the top of the screen.
A loading window saying ‘
Logging...
’ will appear. This window will auto
close when the download is complete and open a new window giving a
line listing of data sets.
Double click on the data that you wish to view and a red line will appear
on the graph. The zoom facility and file save work as previously
detailed.
To delete the data files, press and hold
REC/Setup
, then turn the
instrument on. The instrument display will show “del” to indicate the
memory has had its data sets deleted.


